How long before Solana’s [SOL] long-term downtrend snaps

Disclaimer: The findings of the following analysis are the sole opinions of the writer and should not be considered investment advice.
Bitcoin [BTC] has significantly dropped in price in recent weeks. It faced resistance on the charts at $21.7k and $23k, and the next few weeks might not see a recovery for the king of crypto. In the wake of a fearful market and weak BTC, most altcoins have also lost a lot of value in the market. Solana [SOL] was one of the coins whose downtrend remained unbroken. Yet, the buyers have been able to push prices upward over the past three weeks. Can they continue to exert more pressure?
SOL- 1 Day Chart
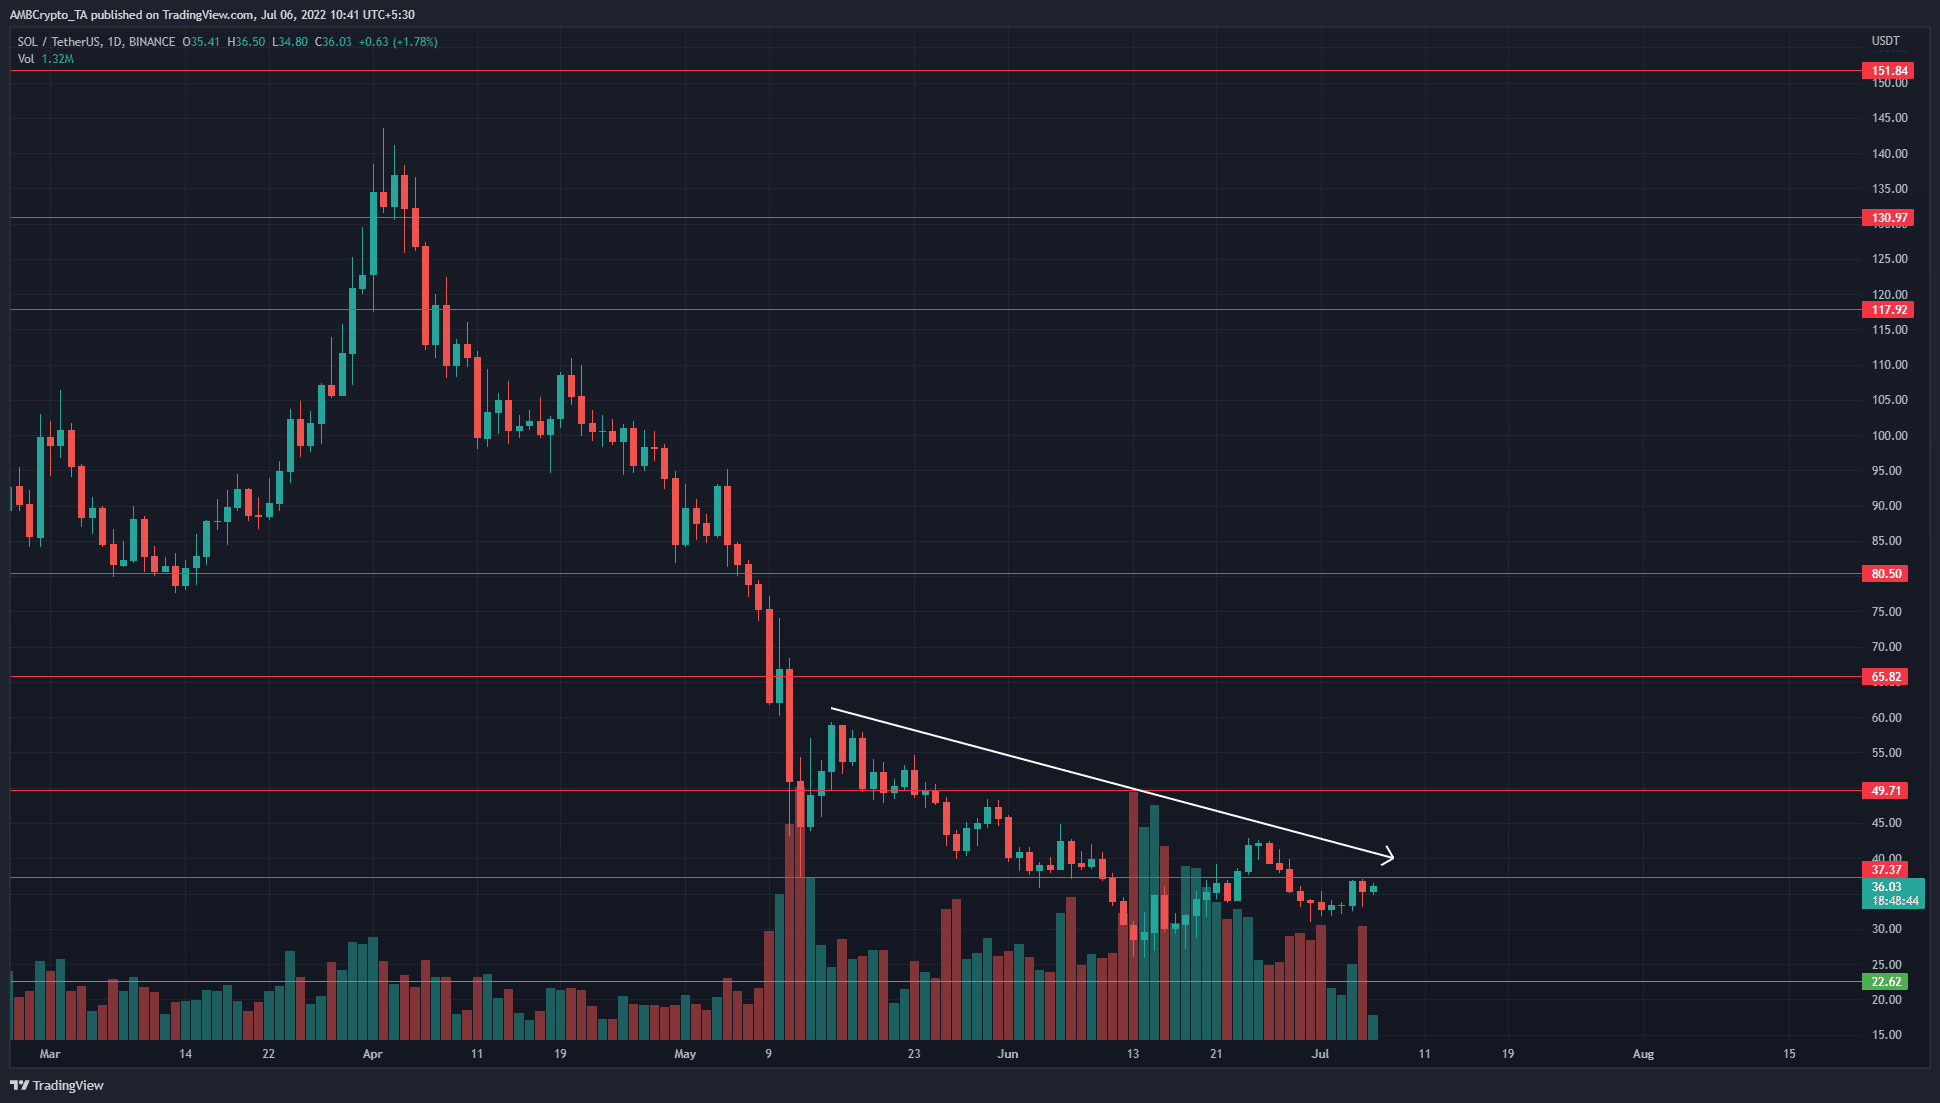
After the mid-March rally, the price has made a series of lower highs and lower lows from April. It was the same as it was from November to March when a strong downtrend brought Solana down from $250 to $80.
The $80 mark looked far, far away for SOL as things stood. The price continued to be in a downtrend, but the buyers were able to force the formation of a higher low at $32 earlier this month. It approached the $37 resistance with some intent, but the bulls still have a lot of work to do.
The $43-$45 area posed stubborn resistance in recent weeks, and the $50 level remained unchallenged since late May. Long-term investors would prefer to wait and watch rather than buy, as another move lower can materialize in a few weeks.
Rationale
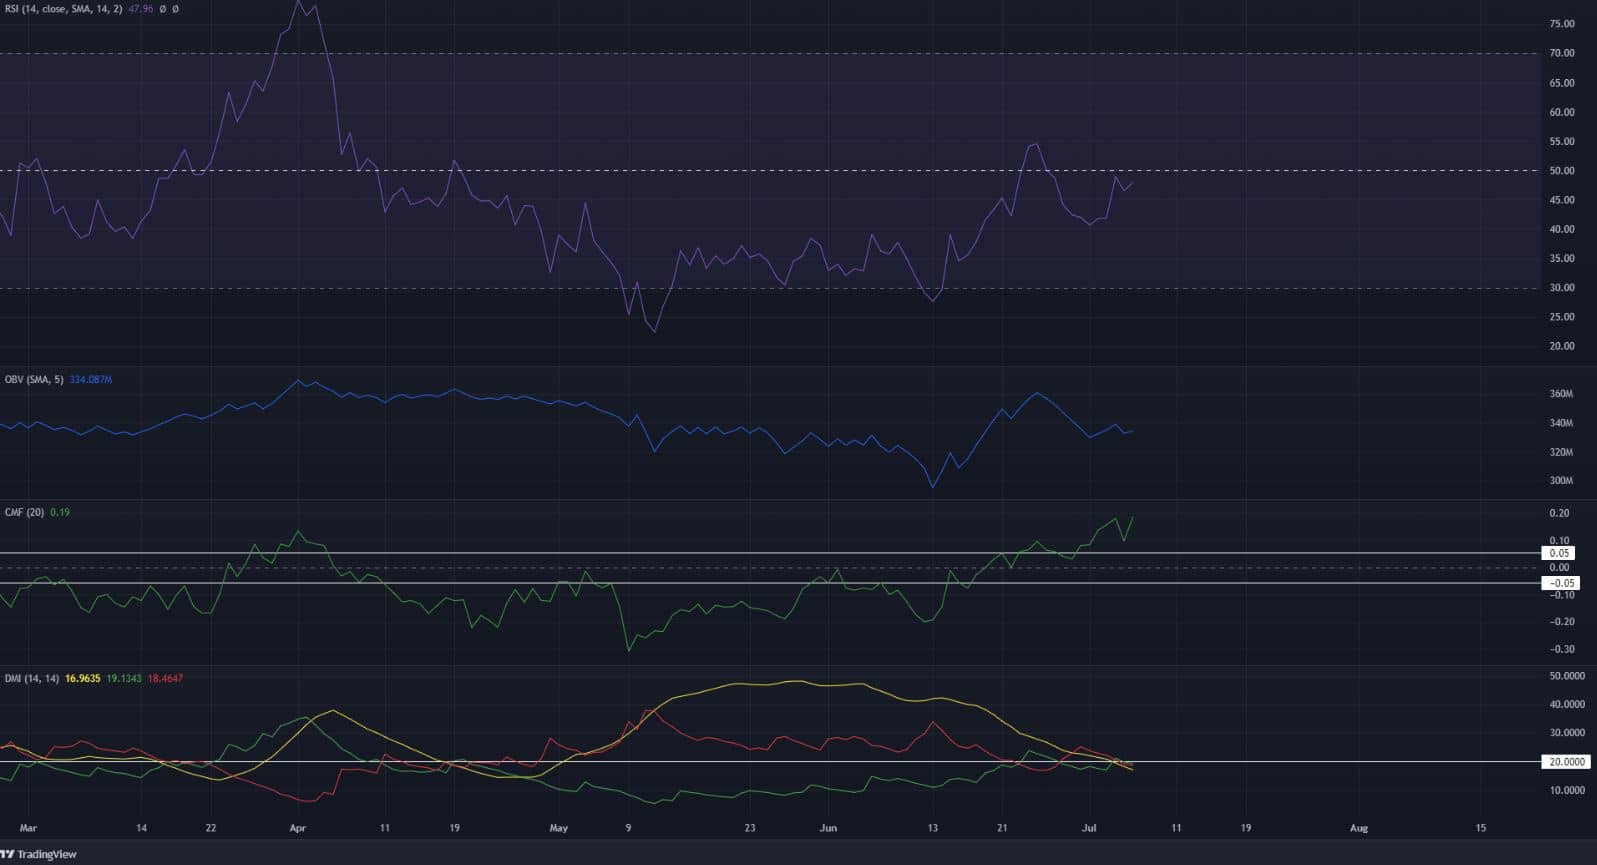
The Relative Strength Index (RSI) on the daily chart remained below the neutral 50 mark. This signaled the presence of bearish pressure. However, it was attempting to make a move past neutral 50. A push above 55 would be encouraging for the bulls and could be an early indication of a move upward.
The On-Balance Volume (OBV) saw a spike upward in June, but it has been flat over the past few days. On the other hand, the Chaikin Money Flow (CMF) has been rising steadily. Taken together, they indicate some rising buying pressure over the past month.
The Directional Movement Index (DMI) showed the lack of a strong trend, as the Average Directional Index (ADX) (yellow) and the -DI (red) fell beneath the 20 mark. Hence, the inference was that the bearish trend had lost strength.
Conclusion
The indicators showed that some bullish momentum could be around the corner for Solana. However, it was not a strong likelihood yet. The price action showed a bearish structure, and the $45 and $50 zones would likely see acute selling pressure.


