Investors must brace themselves as Bitcoin Cash goes downhill in the coming weeks

Though off to a strong start in September, Bitcoin Cash seemed to have taken its foot off the pedal. Caught between two corrective phases on 7 and 20 September, the price steadily declined after forming a local peak above $800.
Moreover, BCH’s latest drawdown towards 38.2% Fibonacci level identified vulnerabilities in the market which could extend all the way back to July lows. With sentiment also expected to be sour due to a recent death cross, BCH bulls certainly faced a tall mountain to climb. At the time of writing, BCH traded at $549.2, down by 4.8% over the last 24 hours.
BCH Daily Chart
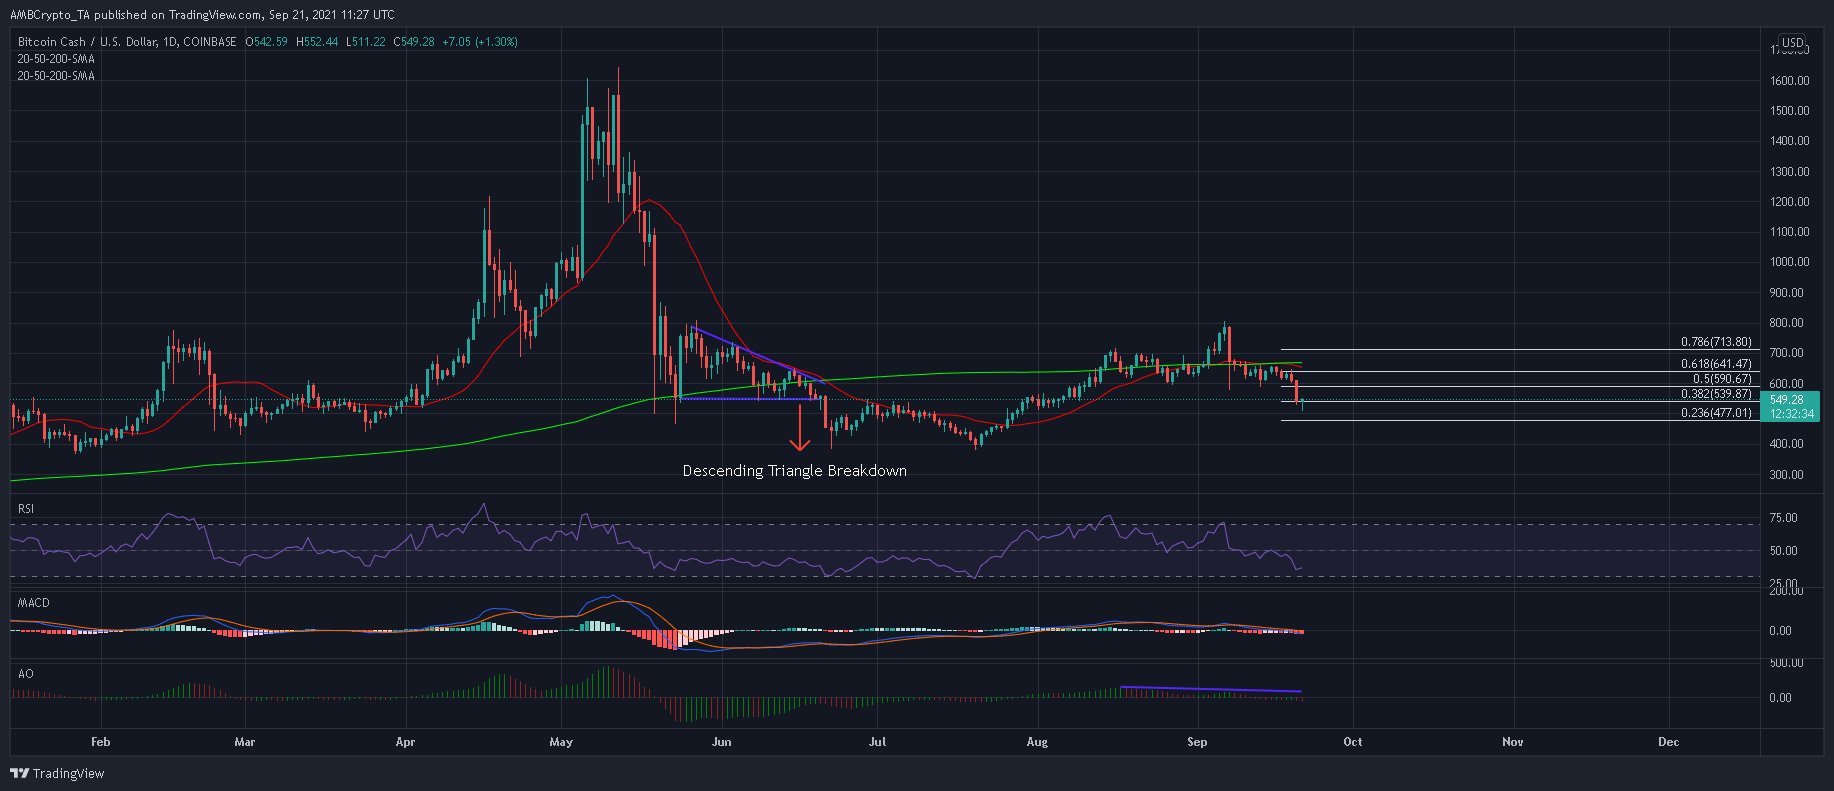
A near 16% decline from the 50% Fibonacci level pushed BCH to the all important 38.2% Fibonacci level. Back in late-June, BCH suffered a 31% sell-off after it pierced below the aforementioned level on the back of a descending triangle. Hence, to dissuade short-sellers from the market, BCH would need to keep its neck above the $540-mark.
However, certain factors in the market could not be overlooked. For instance, each of BCH’s indicators slipped below their equilibrium points for the first time in nearly 2-months, while a negative crossover between the 20-SMA (red) and 200-SMA (green) created some more uncertainties.
Reasoning
Even though corrective phases have been overserved previously in the market, BCH’s RSI held above it mid-line. This was not the case anymore after the RSI shifted below 45 and into bearish territory. In fact, the RSI was yet to touch the oversold territory, which meant that BCH could see some more losses rather than an immediate reversal. Such was the case with the MACD and Awesome Oscillator as well, which slipped below their equilibrium levels. If sentiment continues to be weak, the 23.6% Fibonacci level and $400 would come back into play.
Conclusion
Bitcoin Cash’s long term narrative took quite a hit after prices declined below the 50% Fibonacci mark. In fact, this also negated a bullish setup which was highlighted in an earlier article. BCH’s indicators also fell into bearish zones after this retracement. Considering these factors, BCH was open to a further sell-off towards the $400-mark in the coming weeks.


