This will be Bitcoin’s saving grace amid dwindling prices

The past few days have been quite distressing for Bitcoin bulls. During the early hours of Tuesday, the asset’s price managed to go as low as $40.8. The aforementioned level was previously visited by the king-coin back in early-August. However, BTC did manage to pick itself up from the lows, and was trading back at $43.4k at the time of writing.
Undeterred fundamentals
Despite the on-and-off price setbacks, Bitcoin’s network remained resilient. The king-coin’s hash rate continued to inch higher last week and had already reached 150 Exahash on a 7-day moving average basis. When compared to its July lows, the hash rate has recovered by over 52%. By and large, this meant that the network has been getting even more secure with every passing day since July.

Miner behavior
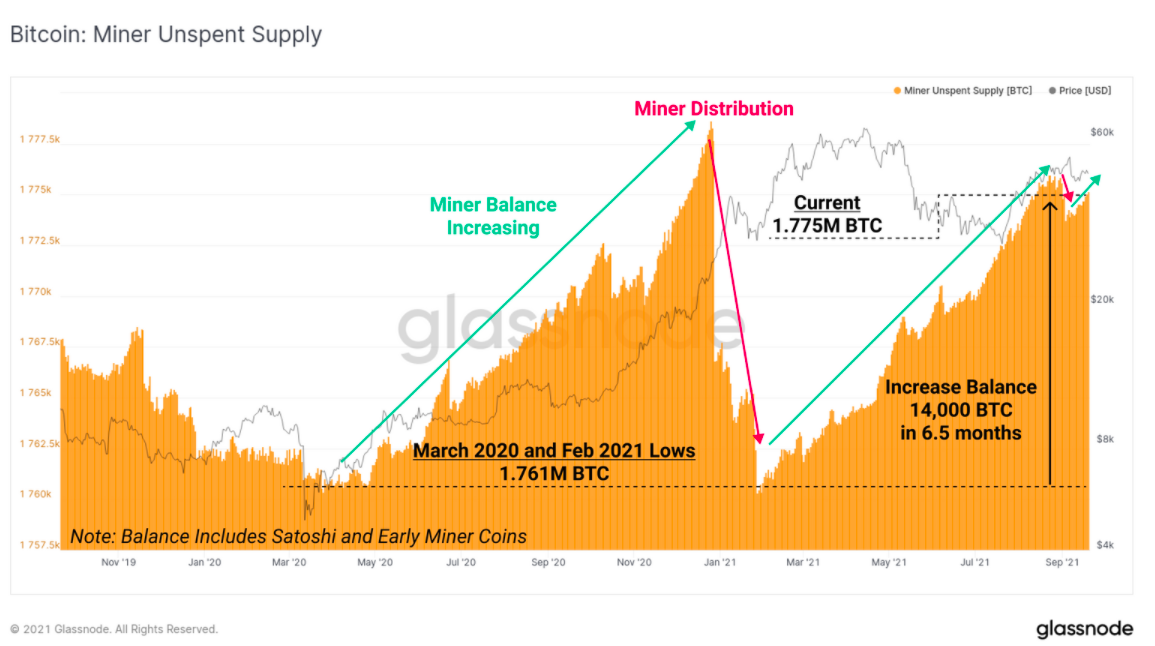
Since last year, miners have exhibited the tendency of HODLing a larger portion of mined coins, when compared to the previous cycles. However, around 1360 BTC were spent by the miners in late August while a moderate sell off took place in early September as well. Nonetheless, at the time of writing, it was observed that the miner unspent supply was back in play.
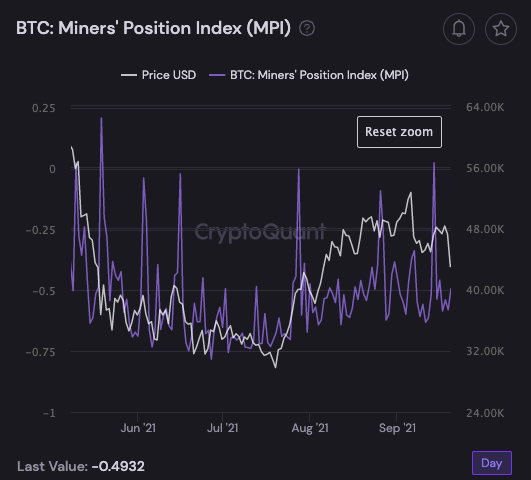
In fact, in a span of merely 6.5 months, miners managed to accumulate around 14,000 BTC, making the number of spent coins almost negligible. The accumulation trend was further re-asserted by the state of the MPI. The Miners’ Position Index is the ratio of all Bitcoin leaving miners’ wallets to its one-year moving average.
A value above 2 on this indicator implied that miners are actively selling in market. Nonetheless, the -0.49 depicted on the chart below clearly highlights the accumulation/HODLing tendency.
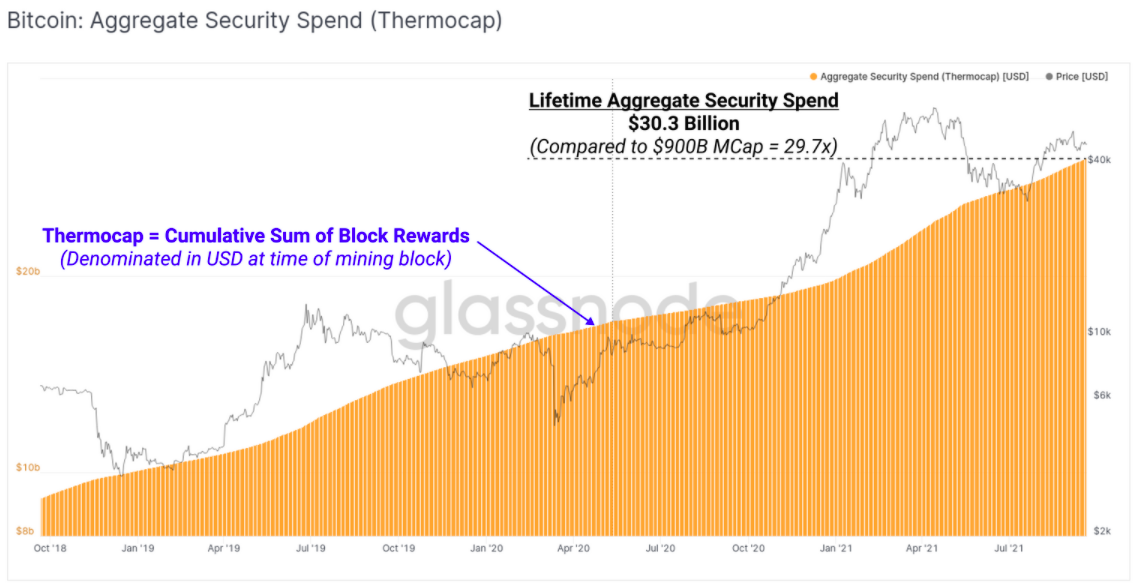
The state of the thermocap, a fundamental valuation model for Bitcoin representing the aggregate security spent to date, further highlighted an interesting trend. The value of this metric has been hovering around $30 billion of late. Parallelly, BTC’s market cap has been oscillating in the $800-$900 billion range.
When the readings of both metrics were combined, it became quite clear that Bitcoin was trading at a multiple of approximately 29x above the production cost. Notably, bull cycle tops generally peak between 32x and 64x and the current scenario indicated that the market was gradually heading towards the same.
The hash ribbon projection too seemed to be quite appealing at press time. As per this ribbon, Bitcoin tends to reach a bottom when miners capitulate. On the hash ribbon chart, notably, the 30-day moving average was seen trending higher than the 60 day moving average. Such crossovers usually imply that the worst of the miner capitulation is over.
In essence, it can be claimed that Bitcoin’s price would not descend by a substantial value in the coming days. This time too, the fundamentals have the potential to drag the coin out of its misery.


