IOTA, Decred, Basic Attention Token Price Analysis: 29 March

IOTA fell back within its previous range after witnessing a northbound breakout that boosted it to June 2018-levels. Decred was able to shift away from a downward channel and could stabilize at $158.8. Lastly, an upwards breakout from a descending triangle could see BAT rise to a newer ATH on the charts.
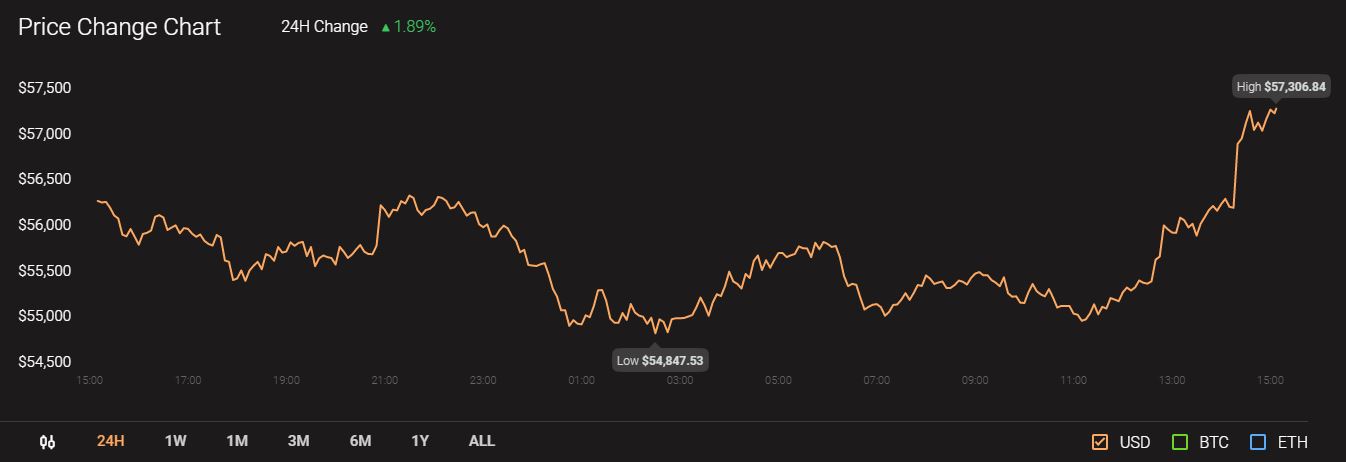
Meanwhile, Bitcoin continued to trade at $57341 and registered a 24-hour trading volume of $46.4 billion.
IOTA
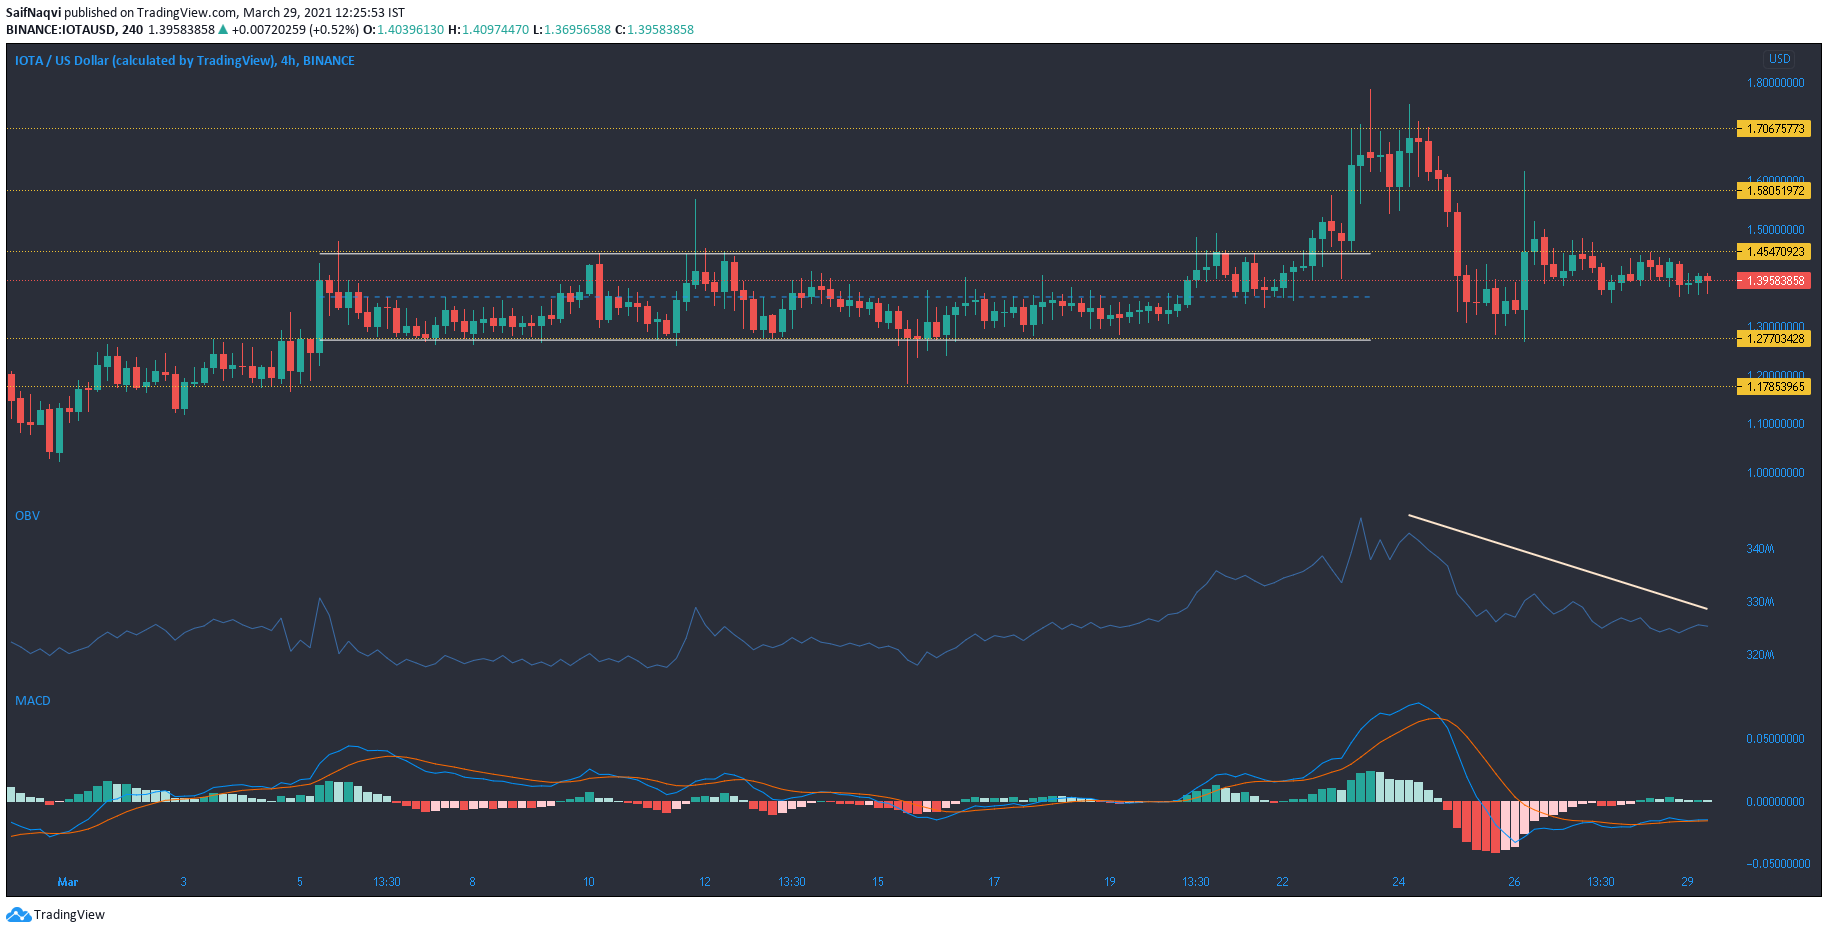
A breakout from a horizontal channel saw IOTA rise to a local high of over $1.76, a level that was last seen in June 2018. However, the price met with rejection and a strong sell-off dragged IOTA to its previous range of $1.45 to $1.27. The OBV formed lower highs and highlighted the selling pressure that resulted in a drop of over 20% in just two days.
According to the MACD, the market showed a state of equilibrium as the fast-moving line was nearly superimposed on the signal line. Moving forward, another round of consolidation looked likely within the current channel. An upwards breakout presented an upside of $1.76, while a breakdown could be extended to the $1.178-support.
Decred [DCR]
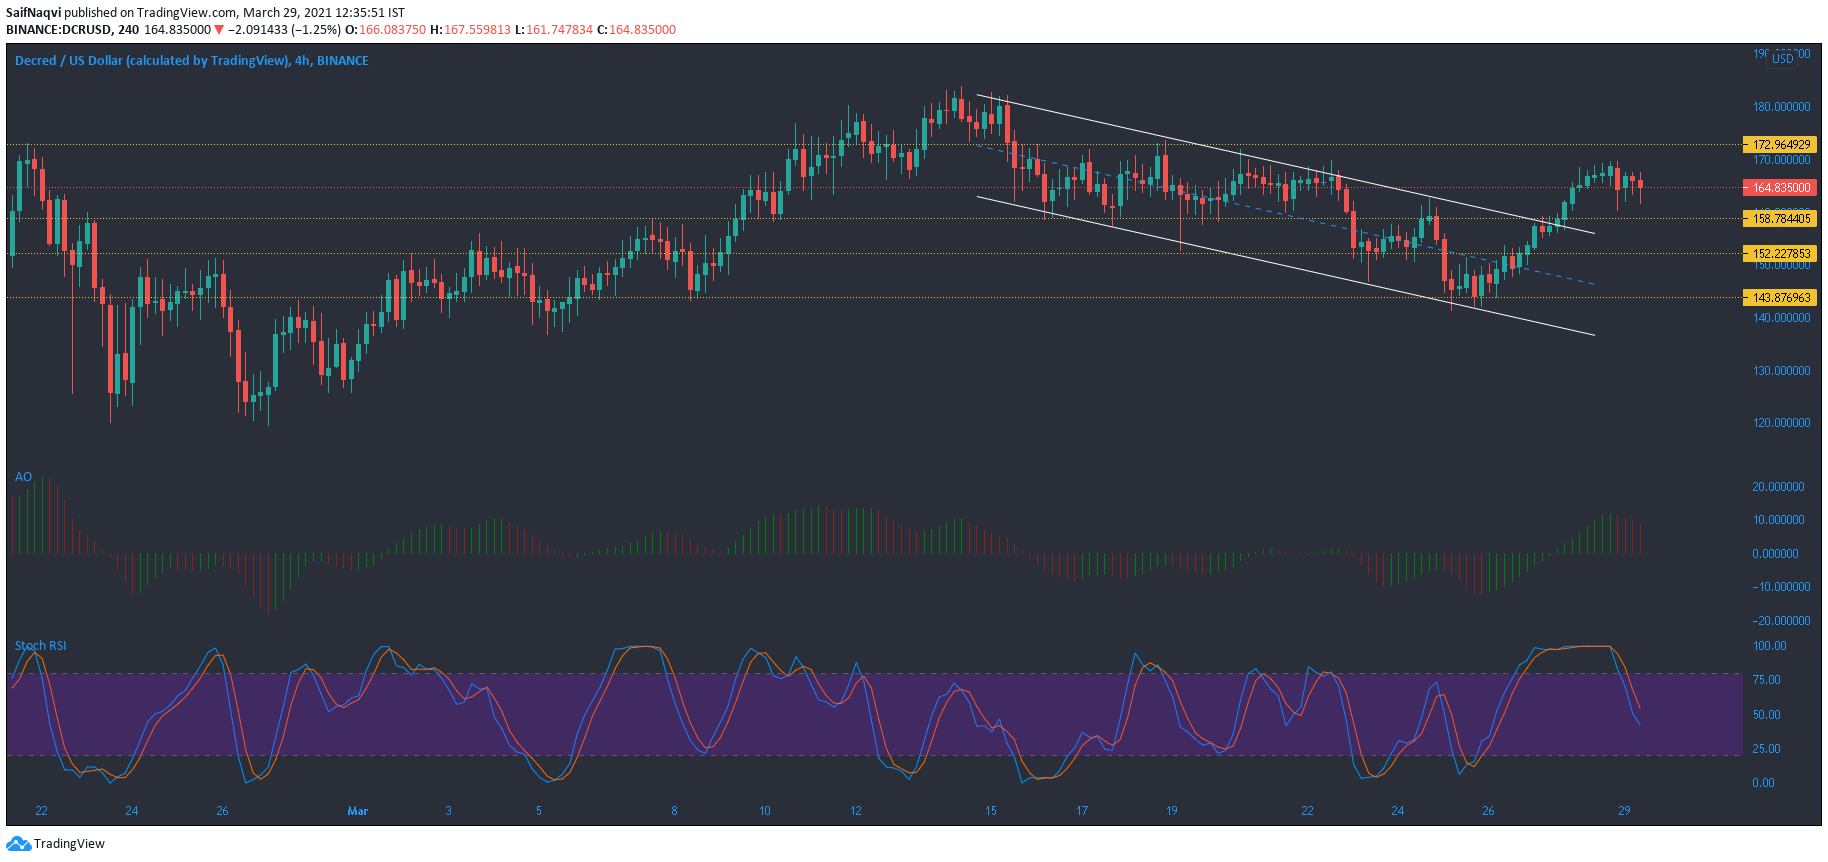
After trading at record levels, Decred lost bullish momentum and moved within a downward channel on the 4-hour timeframe. A rise above the upper trendline saw DCR transition away from this pattern and stabilize between $172.9 and $158.8. However, the technicals noted some bearishness in its market at the time of writing.
The Awesome Oscillator registered a series of red bars, while the Stochastic RSI pointed south from 50. The present support at $158.8 could be called into action if the indicators maintain their stance. A dip below this mark would highlight the next support levels at $152.2 and $143.8.
Basic Attention Token [BAT]
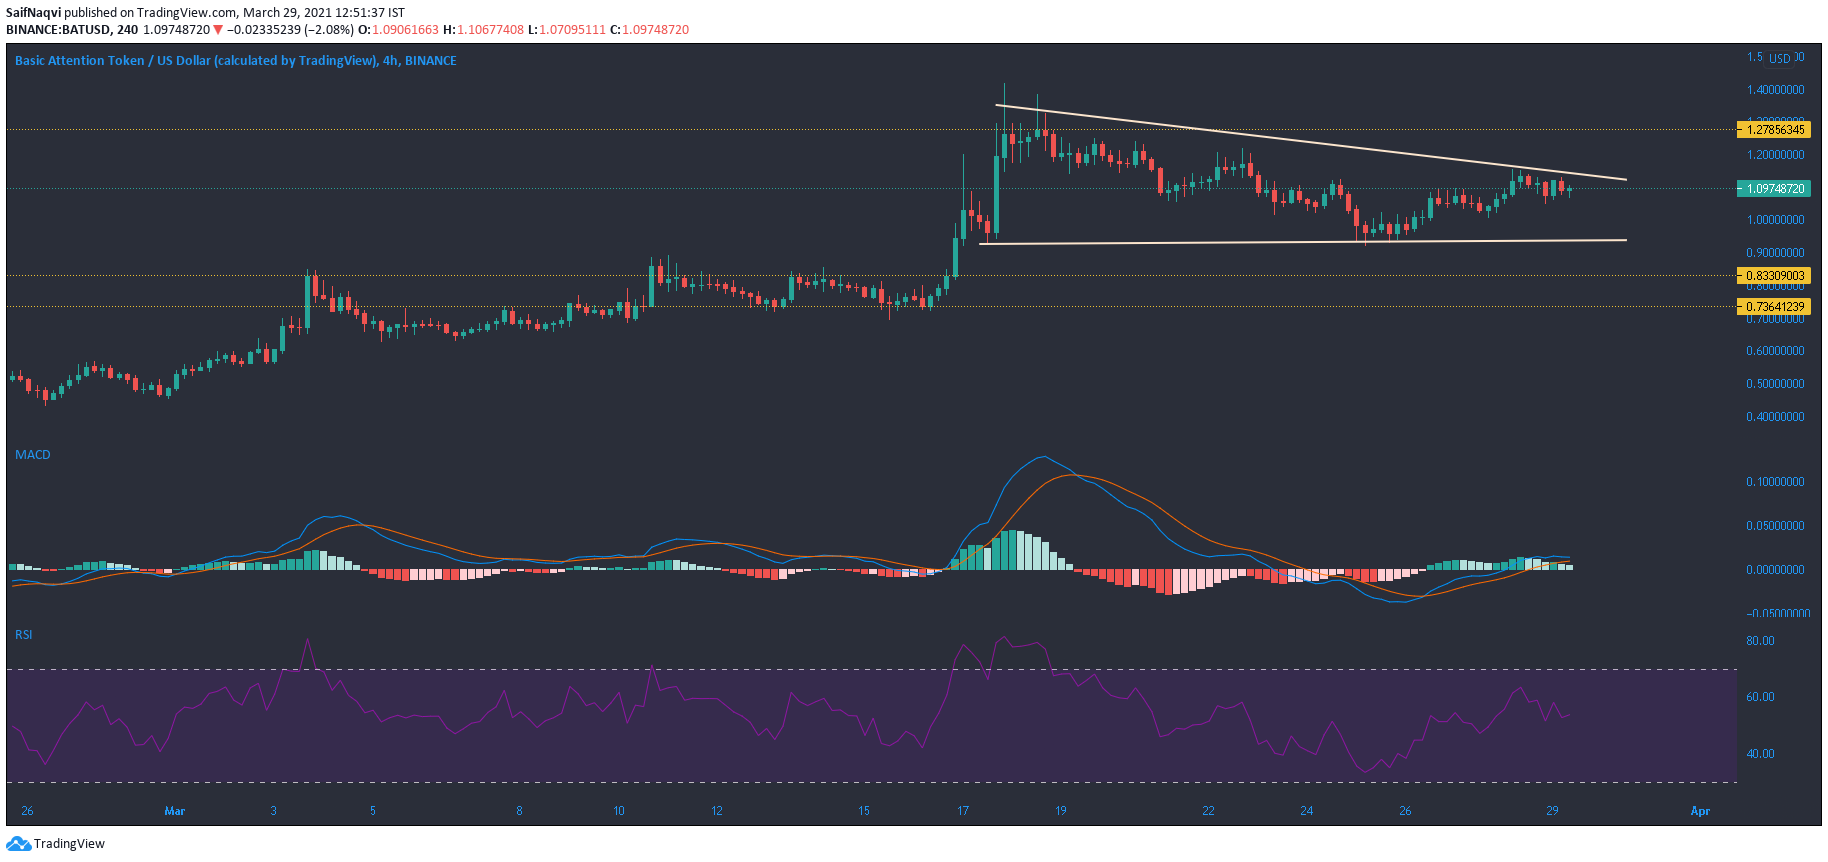
A descending triangle appeared on Basic Attention Token’s 4-hour chart, with a breakout possible in either direction. While the price does generally break south from this pattern, a northbound breakout was also possible if treated as a continuation pattern prior to an uptrend. Such was the case with BAT, which saw record levels prior to the emergence of the pattern
In a bullish scenario, the price could move above the upper trendline and likely rise to a new ATH. In case of a breakdown, the price could fall towards $0.83 or even $0.73. While the MACD line was above the signal line and the zero mark, the histogram noted weakening momentum. The RSI settled slightly above 50 and while this was bullish, further signals were needed for a favorable breakout.