Is $88 the next target for Aave bulls

Disclaimer: The information presented does not constitute financial, investment, trading, or other types of advice and is solely the writer’s opinion.
- The higher timeframe market structure was bullish.
- The retracement into the demand zone around $70 will likely see the bulls initiate another rally.
AAVE rallied from $66.45 on 1 July to $88 on 14 July. This represented gains of 32.4% but since then the token saw a substantial retracement. This saw prices depressed back beneath the $75 mark, but the bulls can initiate another move higher.
Read Aave’s [AAVE] Price Prediction 2023-24
The presence of a bullish order block above the $68.4 support level represented a zone that should be filled with buyers. However, upon a retest over the past few days, the AAVE bulls have not managed to make their mark yet.
The chances of another AAVE rally are good
On the 1-day chart, the $60 and $68 levels have been important since mid-April. Over the past six weeks the AAVE bulls have managed to flip both levels to support once more. The OBV has also climbed higher and maintains its month-long uptrend.
The RSI showed strong bullish momentum earlier this month but has fallen back toward the neutral 50 mark over the past few days. This suggested that the momentum has begun to weaken, but has not yet shifted bearish on the daily chart.
The price action showed the bulls were dominant. The market structure of AAVE was bullish and the recent higher low at $68.7 would need to be broken before the structure flipped bearishly. The bullish order block (cyan) which initiated the jump to the $88 level began from this zone, which meant that the retest could see a strong positive reaction.
Is your portfolio green? Check the Aave Profit Calculator
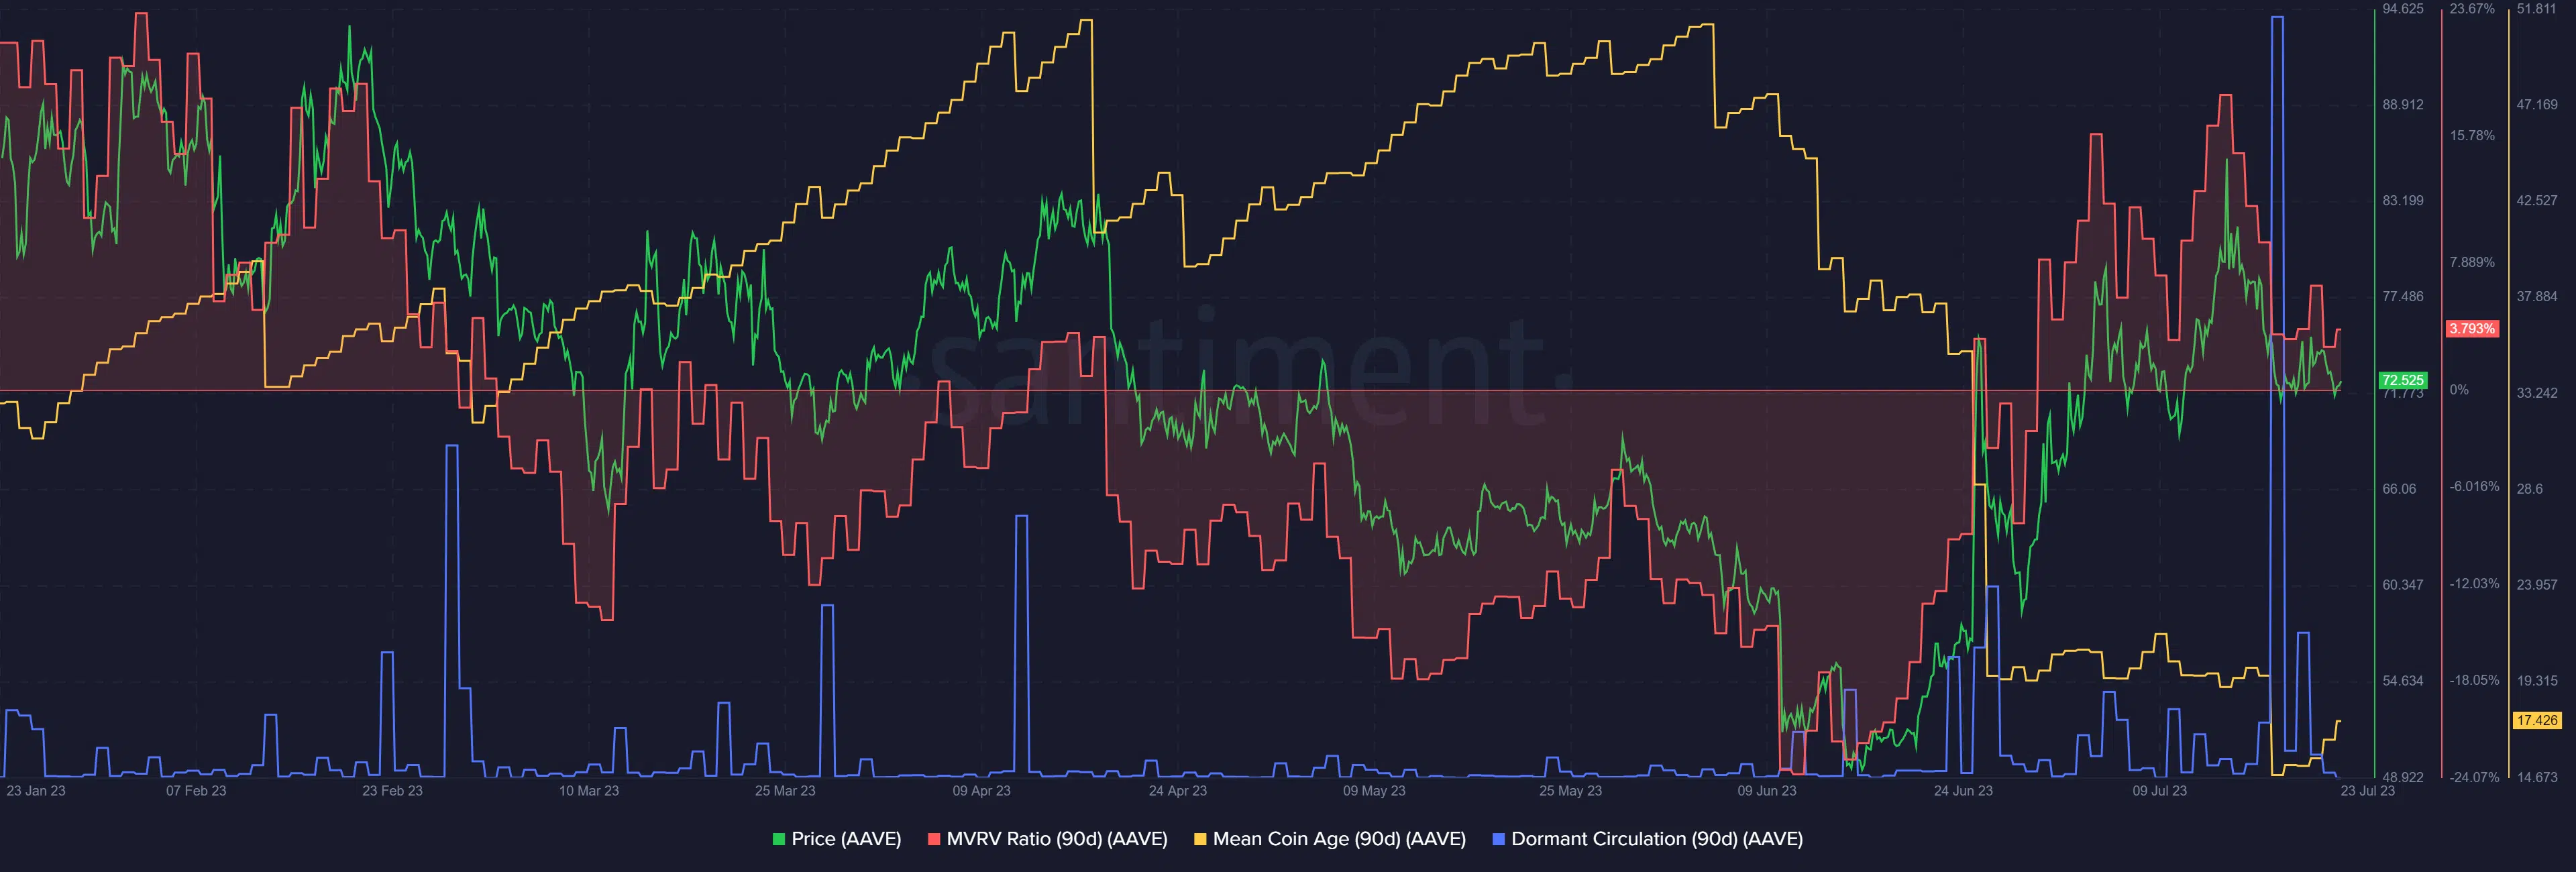
The dropping mean coin age meant buyers did not accumulate despite the price rally

Source: Santiment
Since 9 June the 90-day mean coin age has dropped like a rock. This showed that the token holders were selling and not accumulating AAVE. This argument is not supported by the price action of the past six weeks. The MVRV ratio showed that there has been a wave of profit-taking over the past week.
This was accompanied by a massive spike in the dormant circulation, which indicated a large wave of selling took place. If AAVE can defend the $70 support zone in the coming days, another move higher would be increasingly likely.


