Is BCH ready for a bull run? 77% 30-day correlation with BTC says…

Bitcoin Cash (BCH) sharply declined in a down-channel (white) since November last year. Although it broke out of the pattern recently, it struggled to find a strong recovery since then.
From here on, a break above its two-month resistance (yellow) could lead to short-term recovery. Following this, BCH could possibly fall back towards the mean of its Bollinger Bands (BB). At press time, BCH traded at $333, up by 3.55% in the last 24 hours.
BCH Daily Chart

The alt lost over 64% of its value since its November highs and poked its 13-month low on 24 January. The bulls finally stalled the downslide by ensuring the $275-mark 15-month support. As a result, BCH saw a patterned breakout last month. But this rally was shunned by its immediate trendline resistance.
Recently, the price has been hovering around the upper band of the BB. Thus, hinting that it might be on the slightly expensive side of this downtrend. Further, BCH also overturned its 20/50 EMA to claim a near-term bullish edge.
With the recent buying pressure, investors/traders need to watch out for a sustained close above the $335-mark. Any close above this level could propel a recovery towards the $354-level before the alt falls back into its downtrend. A likely reversal from its immediate resistance could position the alt for a fall towards the $300-level before a bullish comeback.
Rationale
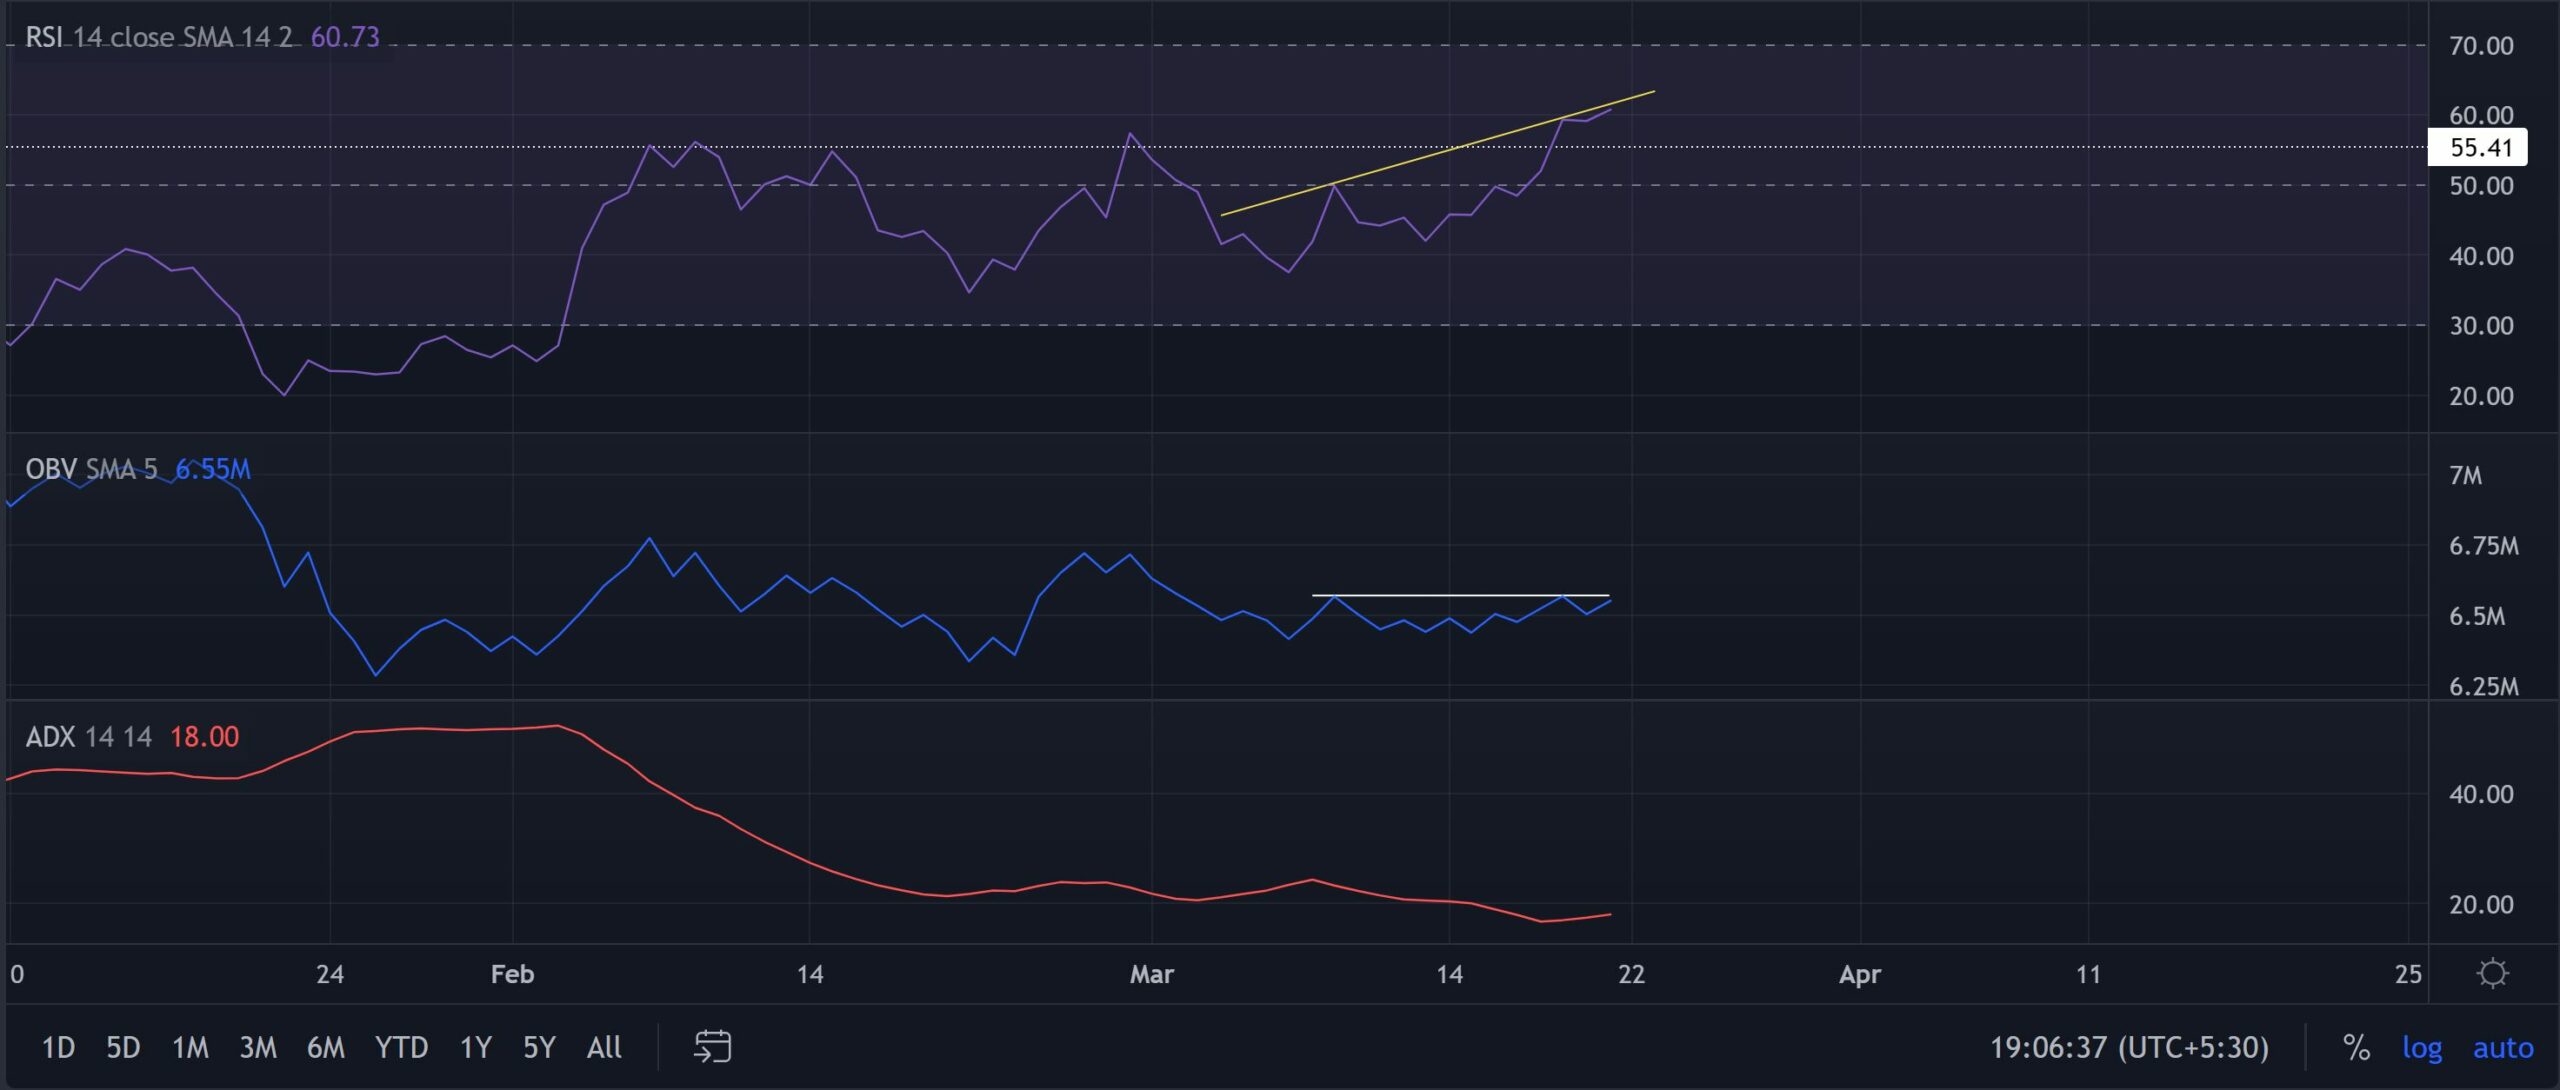
The RSI has been on a clear upturn since crossing the midline while affirming the bullish momentum. A retracement from its immediate resistance may lead to a near-term setback towards the 55-mark.
Moreover, the OBV witnessed flatter peaks in the last 12 days while the price saw higher highs during that time. This reading entailed a slightly weak bearish divergence with its price. Moreover, the ADX of the alt was on a constant downtrend and depicted a weak directional trend.
Conclusion
Considering the oversold readings on its BB and bearish divergence on the OBV, BCH could see a short-term setback towards its 20 EMA before possible reversal.
Having said that, BCH shares a 77% 30-day correlation with the king coin. Thus, keeping a watch on Bitcoin’s movement would be vital in making an accurate decision.


