Is Bitcoin breaking past 2017’s market fractals?

Over the past few months, Bitcoin supply held by hodlers has changed hands on a regular basis as the digital asset navigated through a bullish rally. Long-term hodlers were identified to take profits after Bitcoin crossed $20,000 and then short-term hodlers were responsible for absorbing the selling pressure.
The relationship between these two types of hodlers has played an important role in Bitcoin’s market price over the years, and data suggested we might be heading towards a similar situation at present.
Old Coins to New, New Coins to Old?
According to Glassnode’s recent report, the Spent Output Age Bands suggested that close to 95% of Spent Outputs is presently younger than 3 months. It means new market participants are causing more movement with supply, as long-term hodlers’ impact on the industry has slowed down.
However, cycle supply dynamics of Bitcoin stems down to the understanding of supply held by UTXOs of different lifespans, i.e old coins realizing profits hence turning into new coins.
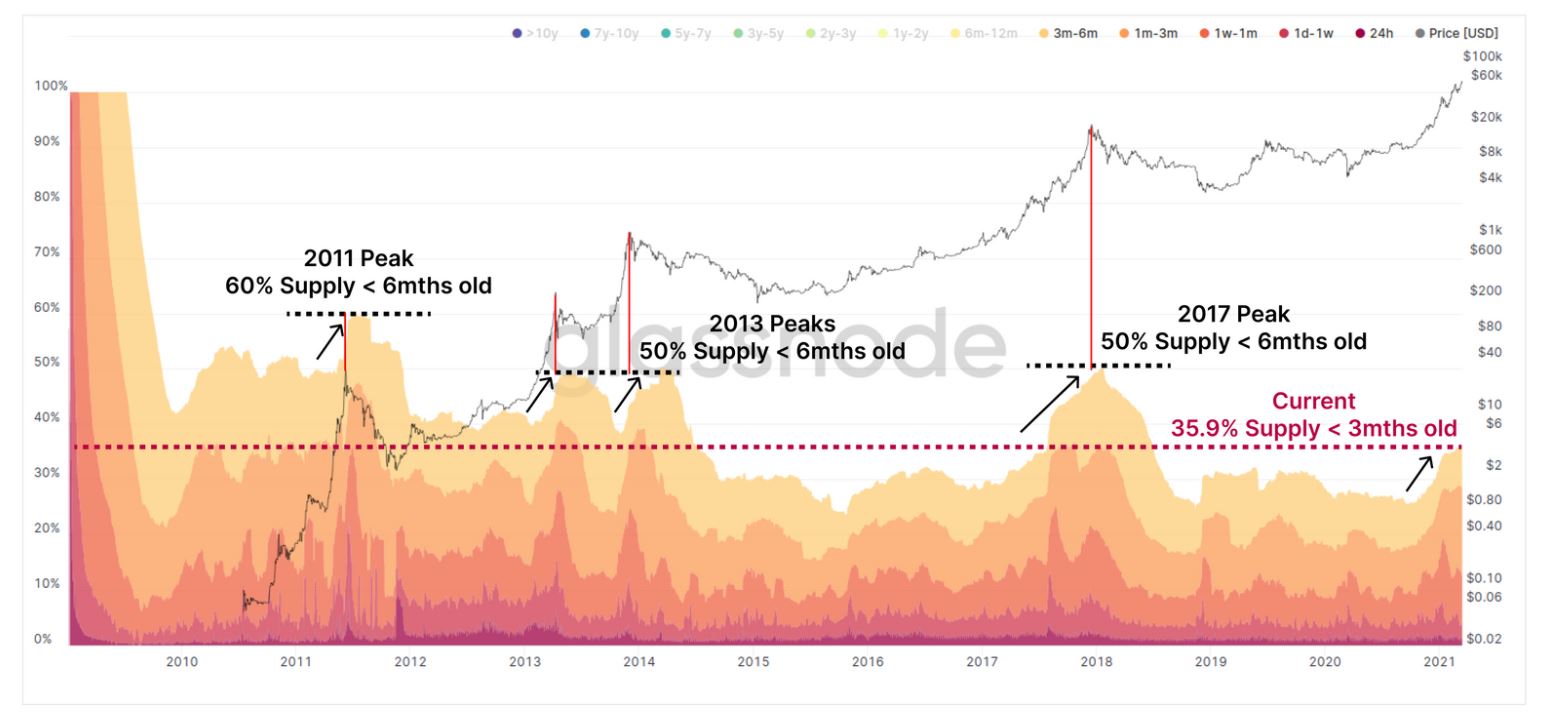
In the present bull run, 35.9% of the circulating supply is currently younger than 6 months, and historically when it has reached 50-60%, the price of Bitcoin has registered a peak.

The above chart exhibits where the current market is with respect to the past market fractals, inferring that the future could register a blow-off at the top.
However, the cycle of crypto-economics has changed over the past 3 years and now there are new assets that keep liquidity in the market better than in 2017; i.e Stablecoins, particularly, Tether in this case.
Bitcoin & Tether present relevance
It is undeniable that USDT has injected much more liquidity in Bitcoin from a volume perspective as users are able to switch between BTC and USDT at a faster rate.
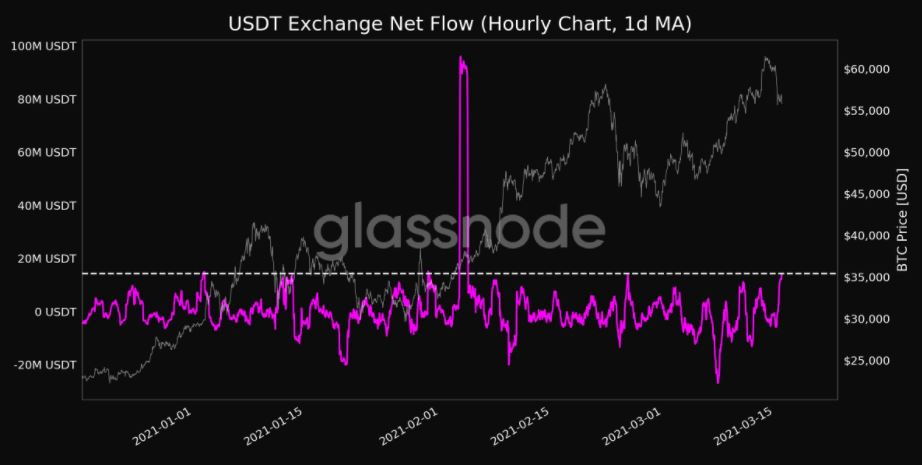
While market fractals carry a level of probability, glassnode data suggested that USDT has registered a 1-month net flow exchange high at press time. It means more USDT is flowing into the exchanges, possibly absorbing the current selling pressure for Bitcoin.
Additionally, it was also observed that USDT supply held by the top 1% of the addresses was declining, indicating distribution and possibly flow into other coins.
What may trigger a massive sell-off now?
Other than a significant liquidity crisis just like in March 2020, a resounding sell-off from the seller’s end is unlikely because long-term hodlers have already been taking profits over the course of January-February 2020. There is currently an added level of assurance since on-chain metrics such as Bitcoin Reserve Risk also emulated a key re-set during last month’s drop so an immediate blow-off might not factor in.