Tron, Aave, DigiByte Price Analysis: 16 March

Tron was moving rangebound between $0.053 -$0.08, with low volatility discouraging huge price swings going forward. Aave rose north from the 23.6% Fibonacci level, while DGB was sandwiched between its 200-SMA and 50-SMA.
Tron [TRX]
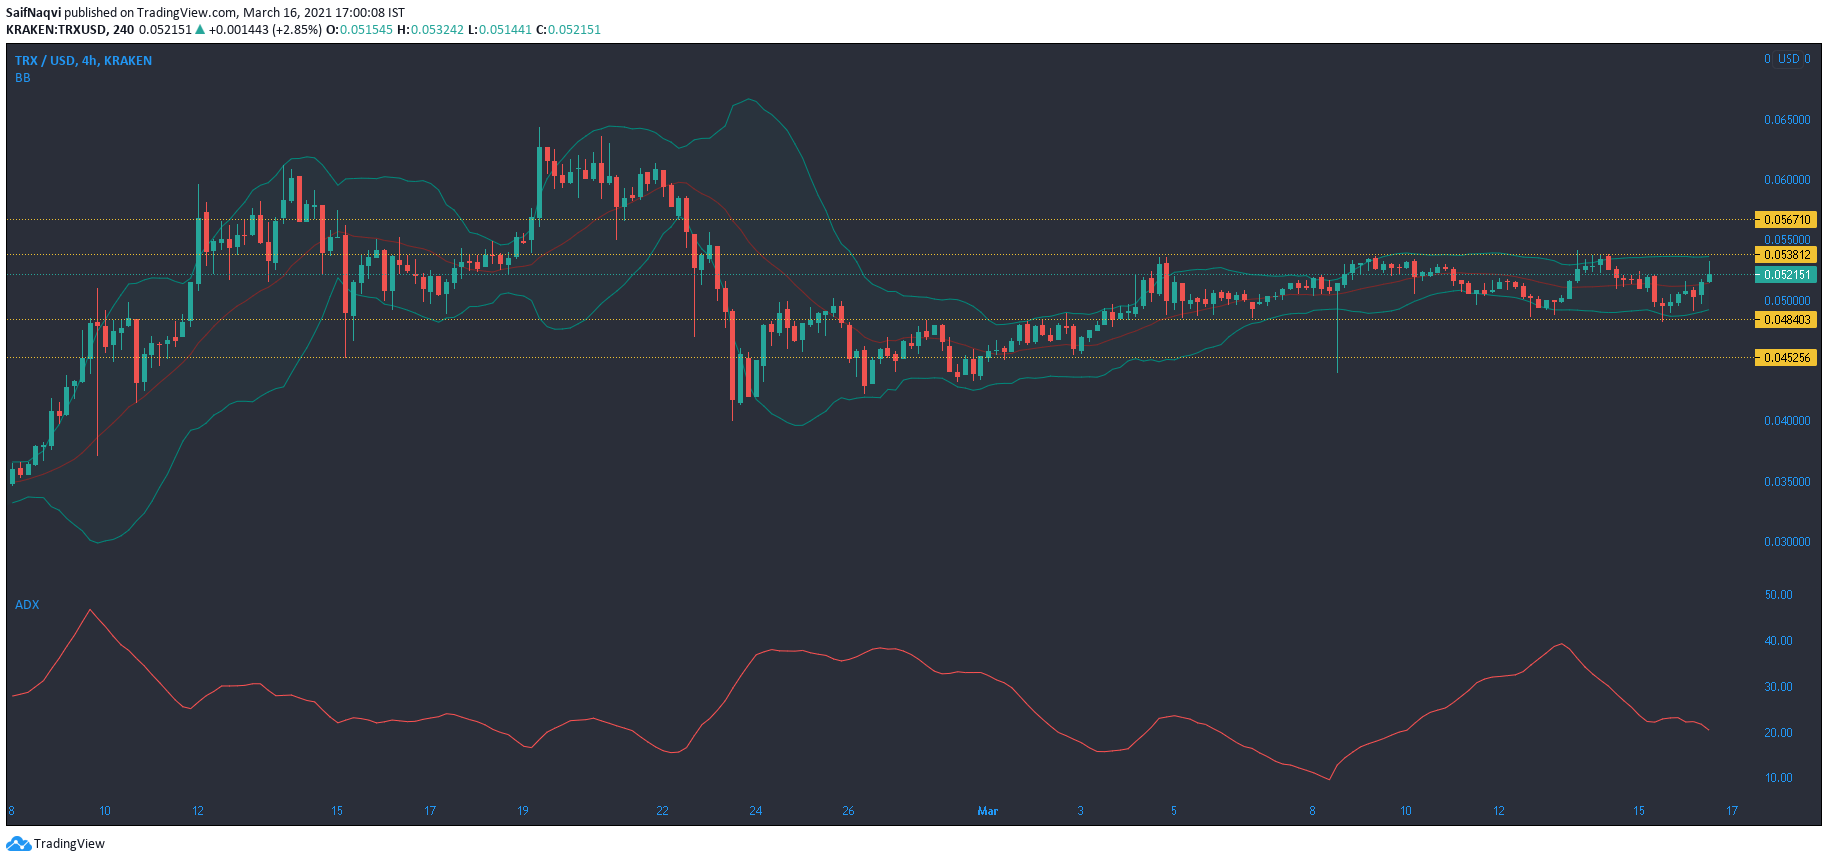
The ADX Indicator on Tron’s charts was pointing lower from the 20-mark and registered a weak trend as the price traded between $0.053 and $0.048. The Bollinger Bands remained constricted as volatility remained low in the market. The press time channel maintained an equilibrium between the buyers and sellers, but the market could tilt heavily in the favor of the side that enforces a breakout.
A northbound breakout would present a target of $0.056, and conversely, a breakdown would see TRX move closer to the $0.045-support. A pickup in the 24-hour trading volumes was an encouraging sign and could fuel a bullish outcome in the short-term.
Aave [AAVE]
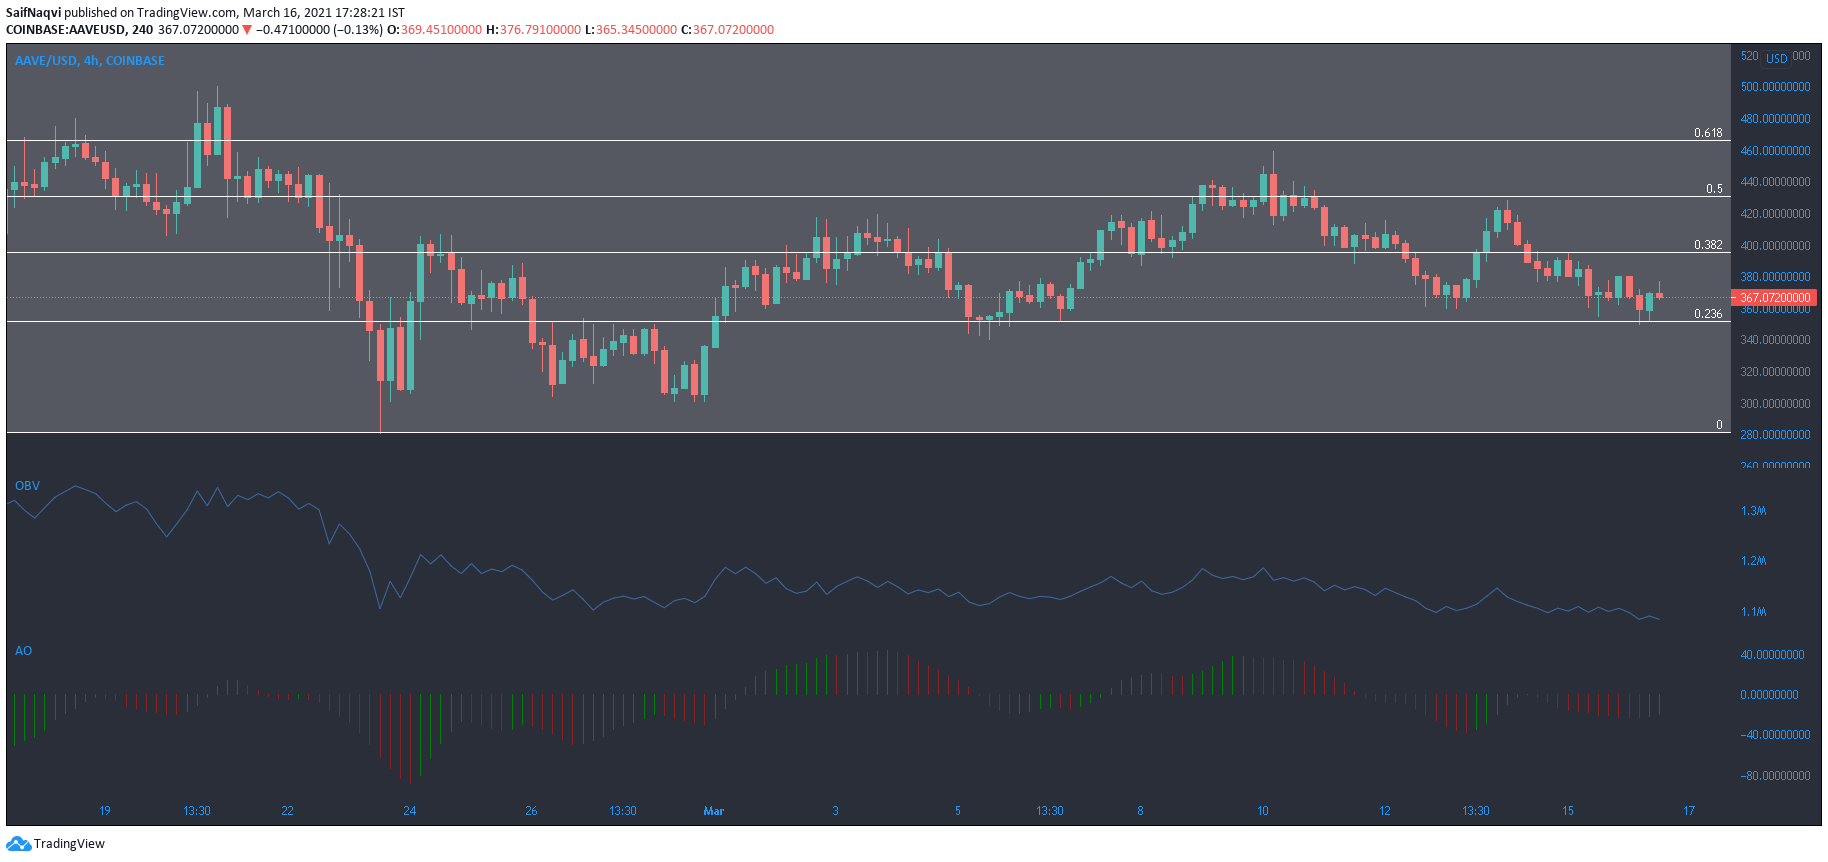
A pullback in the broader market saw Aave drop below the 38.2% Fibonacci retracement level on the 4-hour timeframe as sellers controlled the price. However, the 23.6% level has usually served as a base for buyers and the same was evident at the time of writing as the price moved north from its immediate support.
The Awesome Oscillator pictured momentum on the bullish side, but the OBV indicated a slight dip in buying activity. What remains to be seen is whether AAVE can make a comeback above its overhead resistance in the coming sessions, considering the mixed signals from market leaders Bitcoin and Ethereum.
DigiByte [DGB]
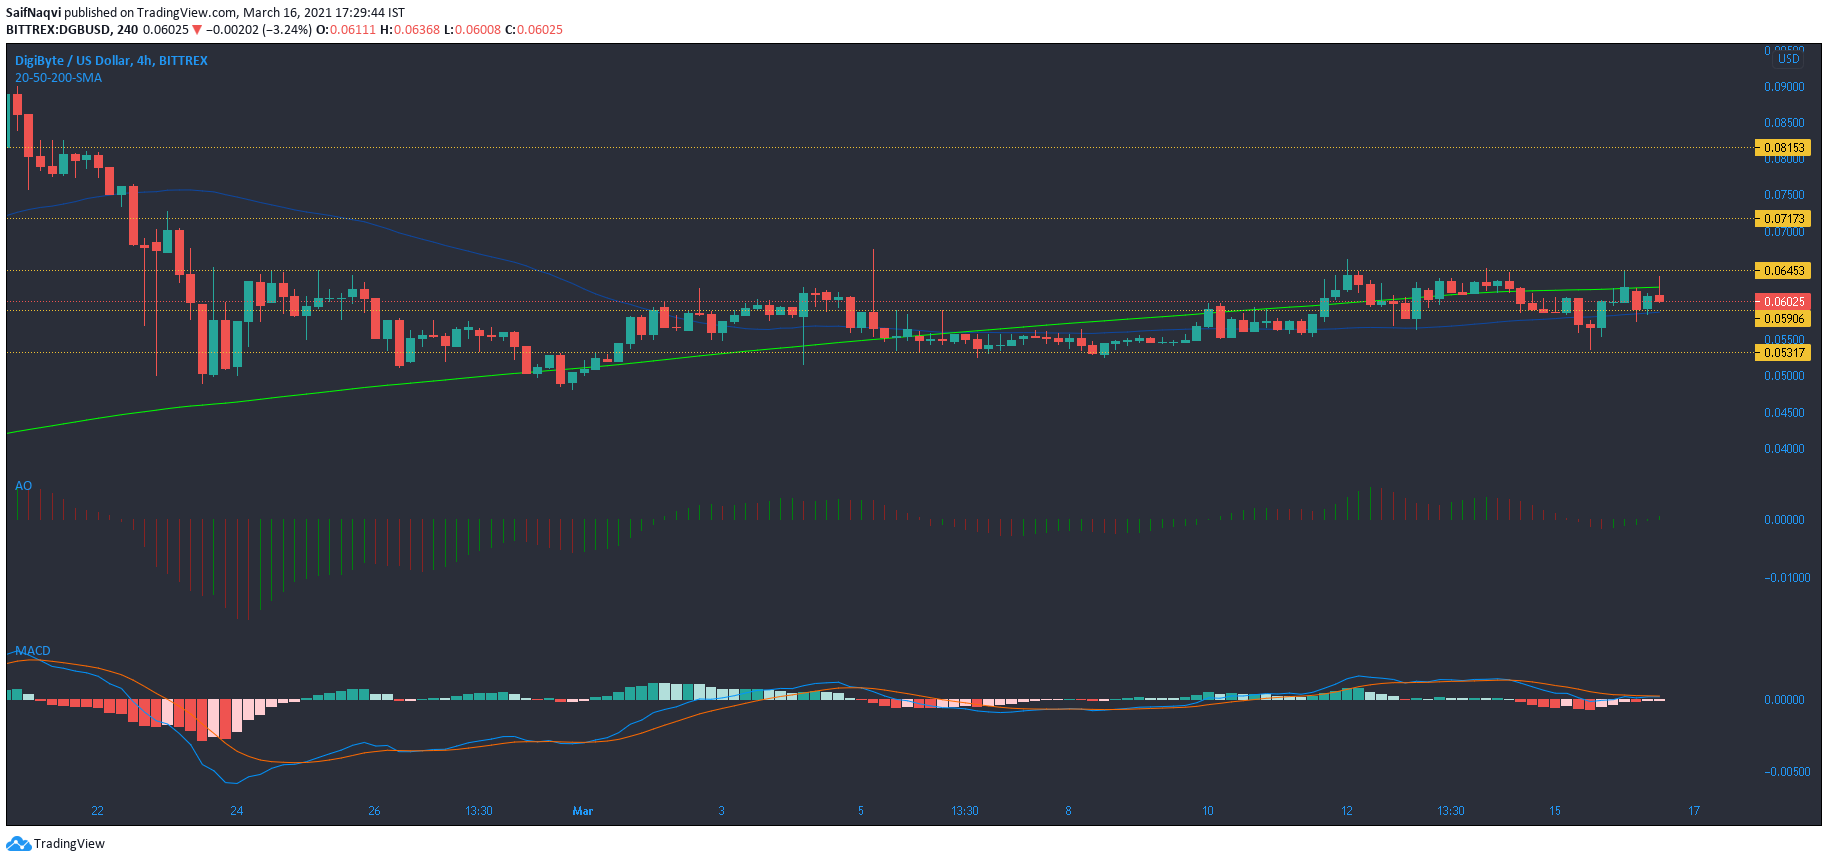
At the time of writing, DigiByte was trading in the green territory, up by over 9% in the last 24 hours. The channel between $0.064 and $0.059 showed strong price oscillation, but it was an important level to regain for a bullish recovery towards a local high of $0.086. However, the bulls would face an uphill battle in the short-term and would need to overturn a bearish market since the 200-SMA had moved above the 50-SMA.
Gains are usually hard to come by in such a scenario and the candlesticks mostly trade below their long-term moving average. Green bars on the Awesome Oscillator and a potential bullish crossover in the MACD were a step in the right direction for the buying side, however.


