- Polkadot’s RSI and stochastic were oversold
- Though Bullish/Bearish Ratio and other metrics were positive, other market indicators opposed a price hike
Polkadot’s [DOT] recent price action did not align with investors’ interest, as its chart was painted entirely red. CoinMarketCap’s data revealed that DOT registered over 8% negative weekly gains and was trading at $4.61 at press time, with a market capitalization of over $5.2 billion.
However, things might soon turn in favor of Polkadot, as CryptoQuant’s data revealed a major bullish signal.
Read Polkadot’s [DOT] Price Prediction for 2023-24
The Polkadot bulls are here
As per CryptoQuant, Polkadot’s Relative Strength Index (RSI) and stochastic, both were in oversold positions. This was a major bullish signal, as it suggested a trend reversal in the coming days.
Interestingly, Polkadot Insider, a popular Twitter account that posts updates related to the ecosystem, recently uploaded the network’s weekly stats. The stats pointed out a few areas where DOT witnessed growth.
👀 Let's get to know the on-chain weekly recap of @Polkadot👇
The below picture illustrates:
👉Daily transfer amount
👉DAILY NEW USERS
👉Total revenue #Polkadot #DOT $DOT pic.twitter.com/TUMHu18ITG— Polkadot Insider 🐂⭕️ (@PolkadotInsider) December 19, 2022
Polkadot’s total revenue in USDT registered a spike on 16 December, a route that was followed by DOT’s daily transaction amount. Several other developments also served as fuel for DOT’s next bull run.
For instance, Firefly Exchange announced that Firefly Beta Release had become available on Polkadot.
Firefly Beta Release is now available on Polkadot! We are excited to announce our public launch and bring a perpetual DEX to Polkadot. As we deploy on Moonbeam, we want to thank @MoonbeamNetwork and @bobanetwork for their collaboration in helping us reach this milestone. pic.twitter.com/GypCwgf3Jw
— Bluefin (@bluefinapp) December 15, 2022
The network’s Bullish/Bearish Ratio also looked promising, which further increased the chances of a price pump.
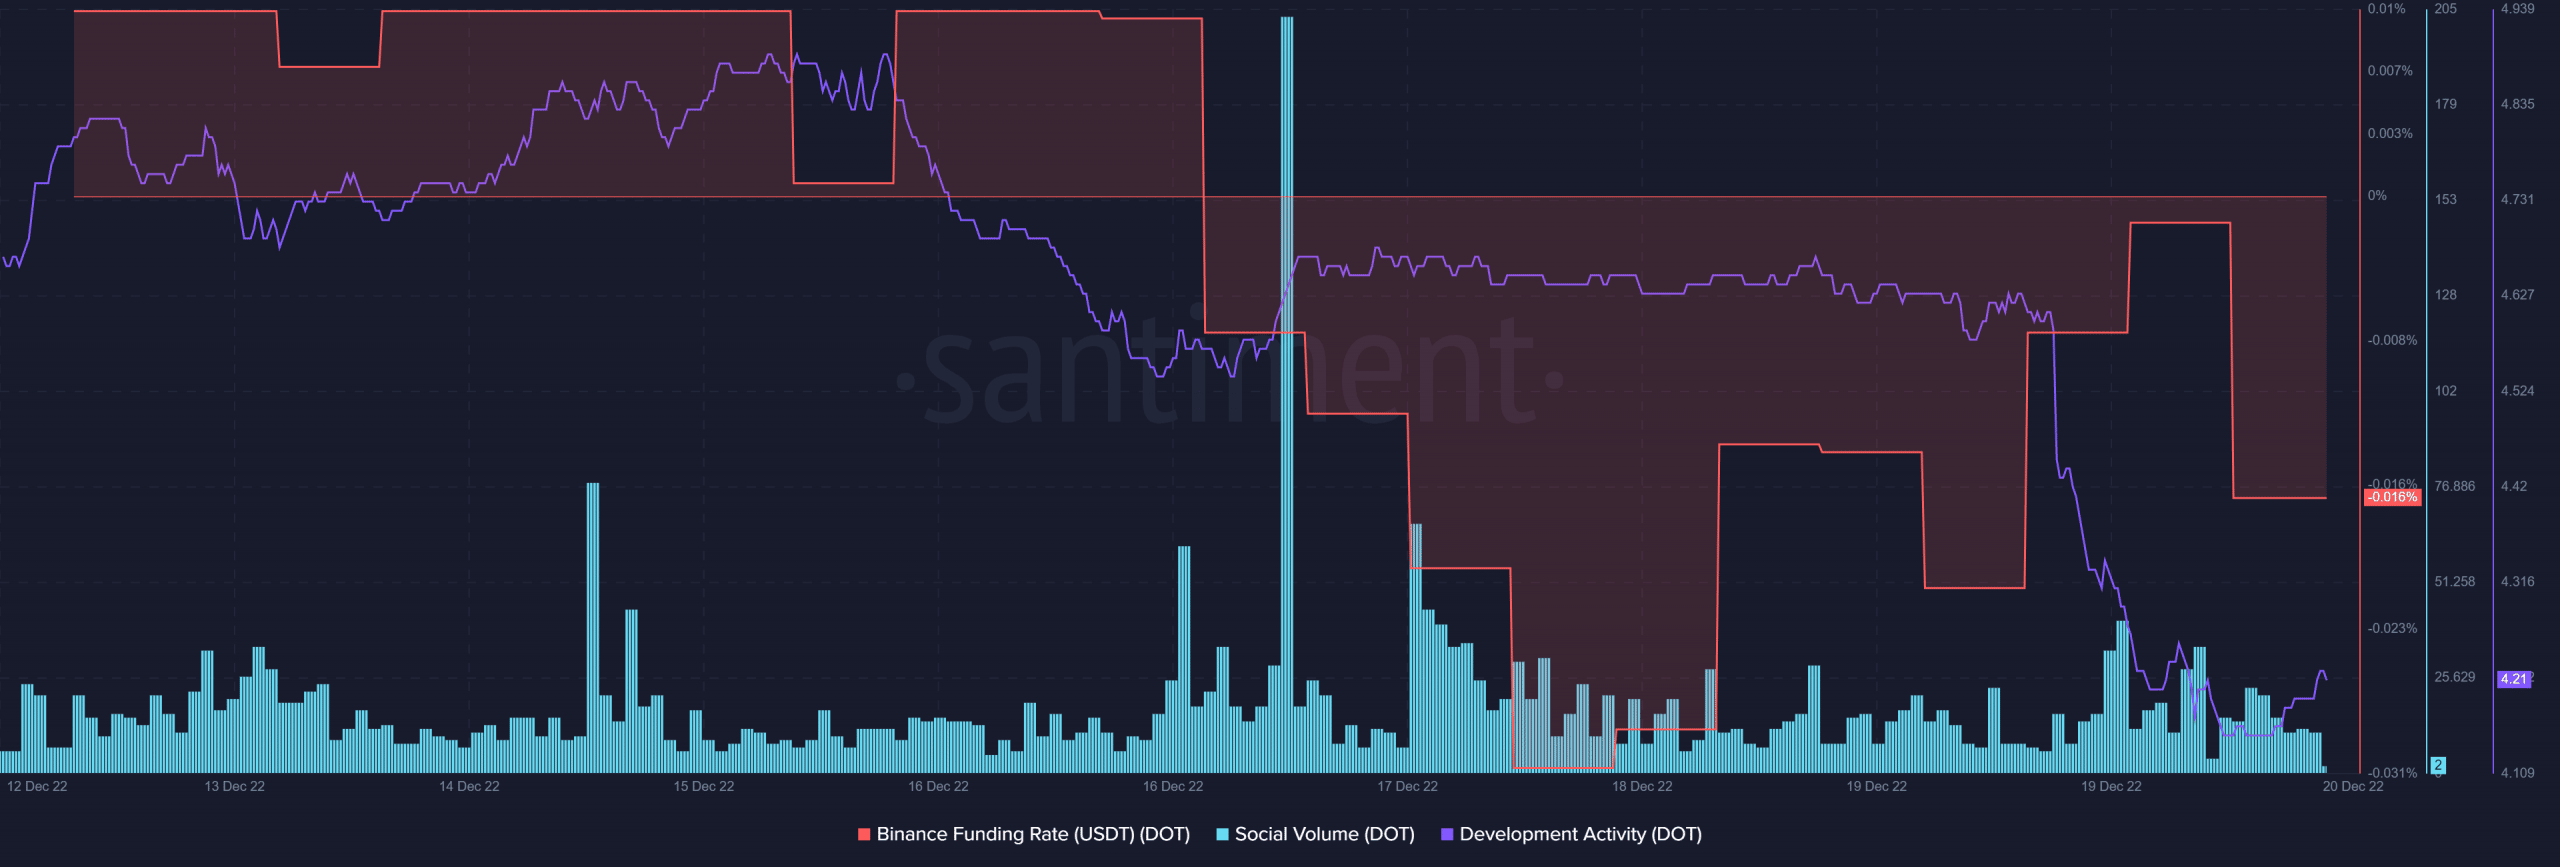
Other on-chain metrics painted a similarly optimistic picture. DOT’s Binance funding rate registered an uptick, indicating higher interest from the derivatives market.
Furthermore, DOT also maintained its popularity in the crypto industry as its social volume went up in the last few days. Nonetheless, DOT’s development activity decreased sharply, which was a negative signal.
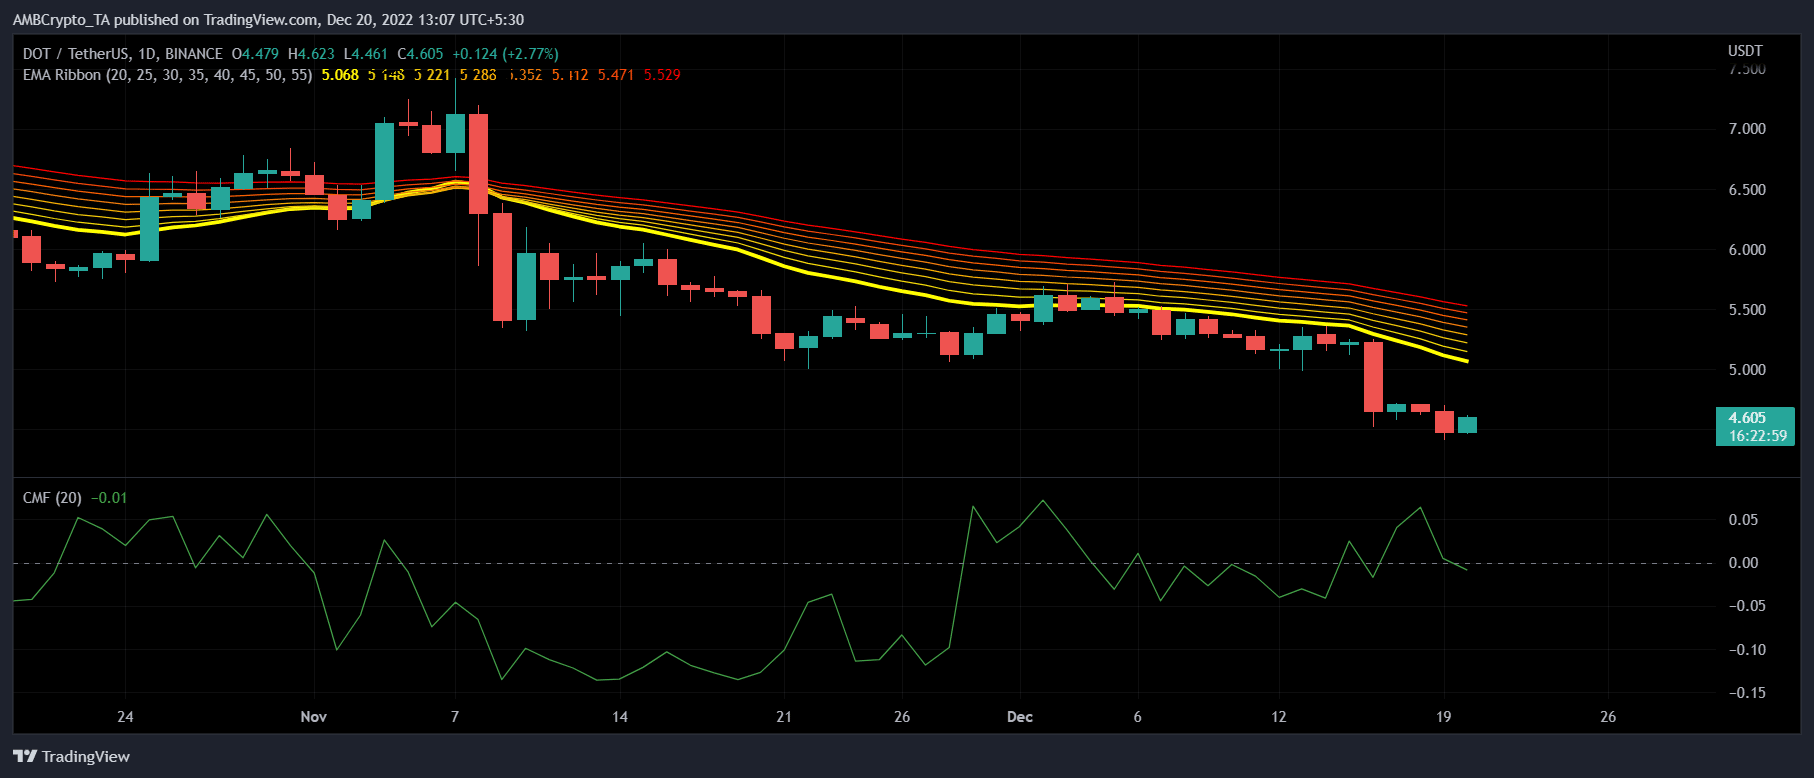
Concerns still persist
Despite the metrics being in DOT’s favor, market indicators revealed that the bears still had an advantage. The 20-day Exponential Moving Average (EMA) was resting below the 55-day EMA, which was a bearish signal. Moreover, the Chaikin Money Flow (CMF) registered a downtick and was in the neutral position, which might cause hindrance in DOT’s next bull run.