
Bitcoin’s price has risen exponentially over the past quarter. While the bull run began towards the end of 2020, considerable gains were noted in the first quarter of 2021. When compared to the coin’s past price history, Q1 of 2021 has been a very significant time period with respect to the gains BTC was able to rake in.
A key moment in Bitcoin’s price action took place on 19 February when the crypto first breached the $55k-resistance. This was also followed by the eventual breach of the $60k-price level. However, since the breach on 19 February and despite the overwhelming bullish outlook for the coin, Bitcoin is now victim to the push and pull syndrome – a phenomenon where an asset endures successive periods of slight price corrections.
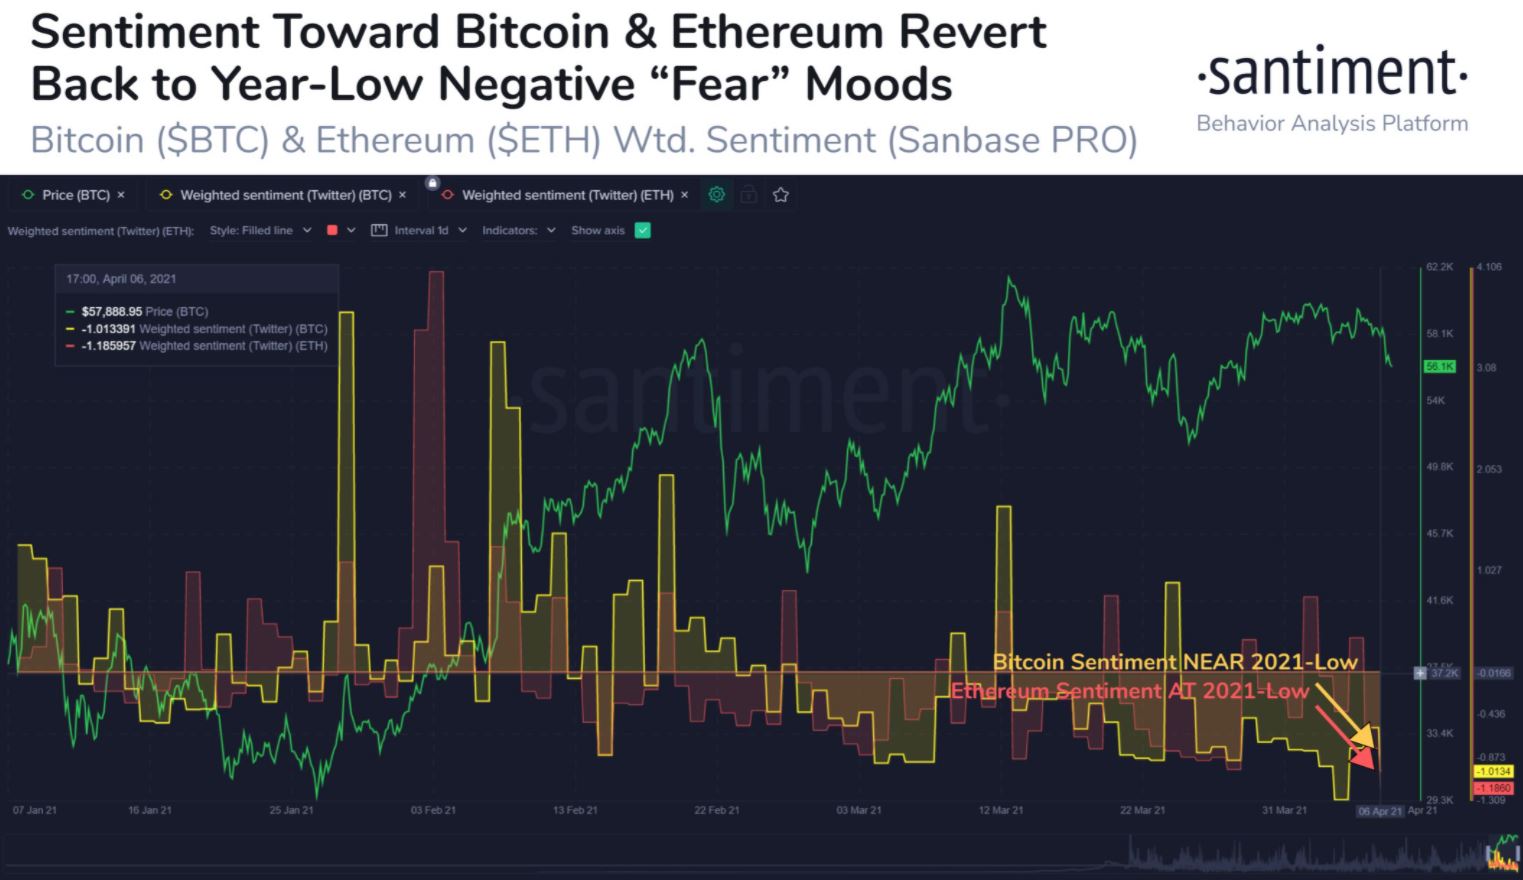
Source: Santiment
While the overall outlook for Bitcoin is bullish and it may well be on its way to hit $80k in the coming months and even $100k before the close of the year, what signal is it giving traders who are more interested in short-term trades?
Interestingly, data provided by Santiment shows that the market sentiment has changed drastically for the king coin and the market’s largest altcoin – Ethereum. The aforementioned data highlighted that the weighted sentiment for both assets fell to the extremely negative territory after BTC retraced and fell back under $60k and ETH flipped the $2k support back into a resistance level over the week.
However, does this also imply that there is a bright side for traders in their bid to accumulate more of each of these two coins? In the past, as per the data, during times of such “negative” sentiments, accumulation has continued and has fueled a trend reversal, one enabling the price to surge. The FUD in such market circumstances for Bitcoin invariably proves to be a good buying opportunity, as demonstrated by previous phases wherein the coin has been subject to price corrections.
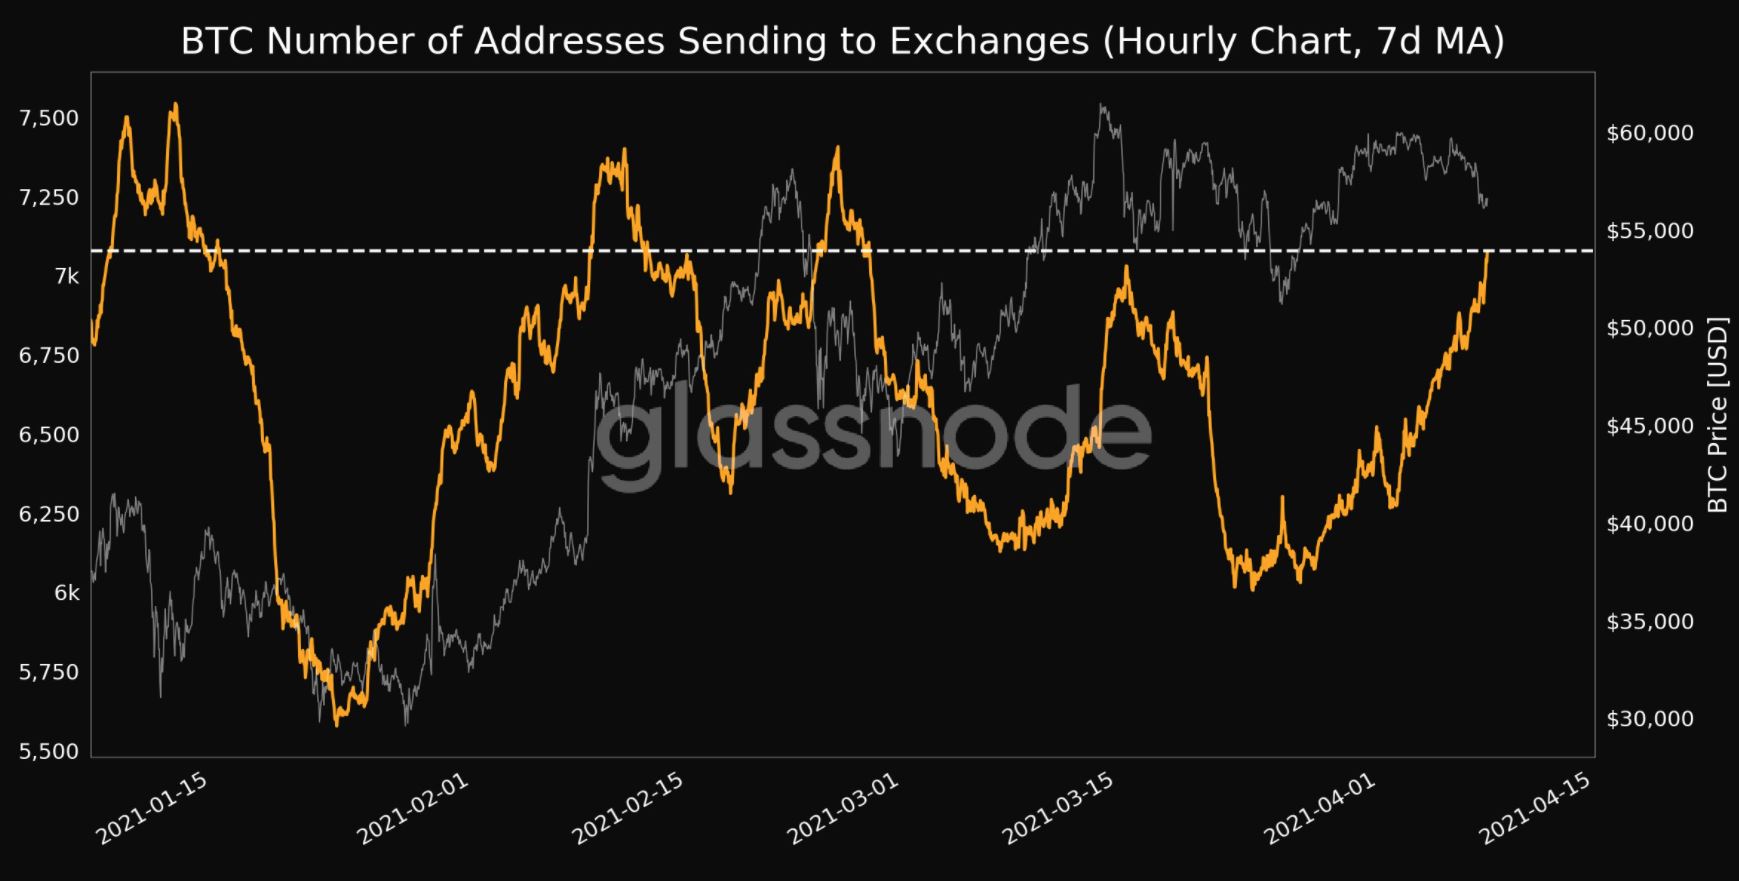
Source: Glassnode
Additionally, it is not difficult to see why there has been a price correction in the short term. Data provided by Glassnode suggested that BTC moving into exchanges recently hit a 1-month high. This is normally a sign of changing hodling patterns from short-term hodlers. As the price climbs, many traders cash in on the short-term gains and this could be one of the reasons why Bitcoin has struggled to breach the $60k level for a long period without seeing a reversal.
However, this has been true for even the range close to $40k and it could just be a matter of time before the current resistance also gives in.
For new traders entering the present BTC market, these minor corrections are the only “low points” that could justify the “buy low sell high” mantra. While the price is likely to appreciate in the coming months, just as how it did over the past 3 months, the price corrections are likely to get smaller in margins.
Over the past week, despite price corrections, the biggest drops have amounted to less than 7 percent. As the bull run transitions into its next phase, these corrections may continue happening with frequency, but may also end up becoming smaller. Hence, recent price corrections don’t necessarily imply the end of the bull run, but a relatively good entry point and a buying opportunity.