Is the worst finally over for Bitcoin?

Market perspective is vital while analyzing the trend of an asset. Consider this – Observing Bitcoin’s 1-hour chart at the moment could completely demoralize potential investors. However, the 1-day or 12-hour chart would not seem drastically bad as the asset is still accruing capital gains for 2021. Therefore, it is essential that we analyze Bitcoin and its recent sell-off from a fundamental point of view, and figure out if we are heading towards a long-term bearish period or if it is just a bump in the road.
Bitcoin metric reversals for the good
Over the past few months, we have discussed several on-chain metrics that seemed over-bullish at times and suggesting an impending correction. However, we continued to ignore and invalidate these signs as the market rallied forward, until the recent crash. Now, according to data, certain indicators have undergone a reboot, and these signs may allow panic to settle down.
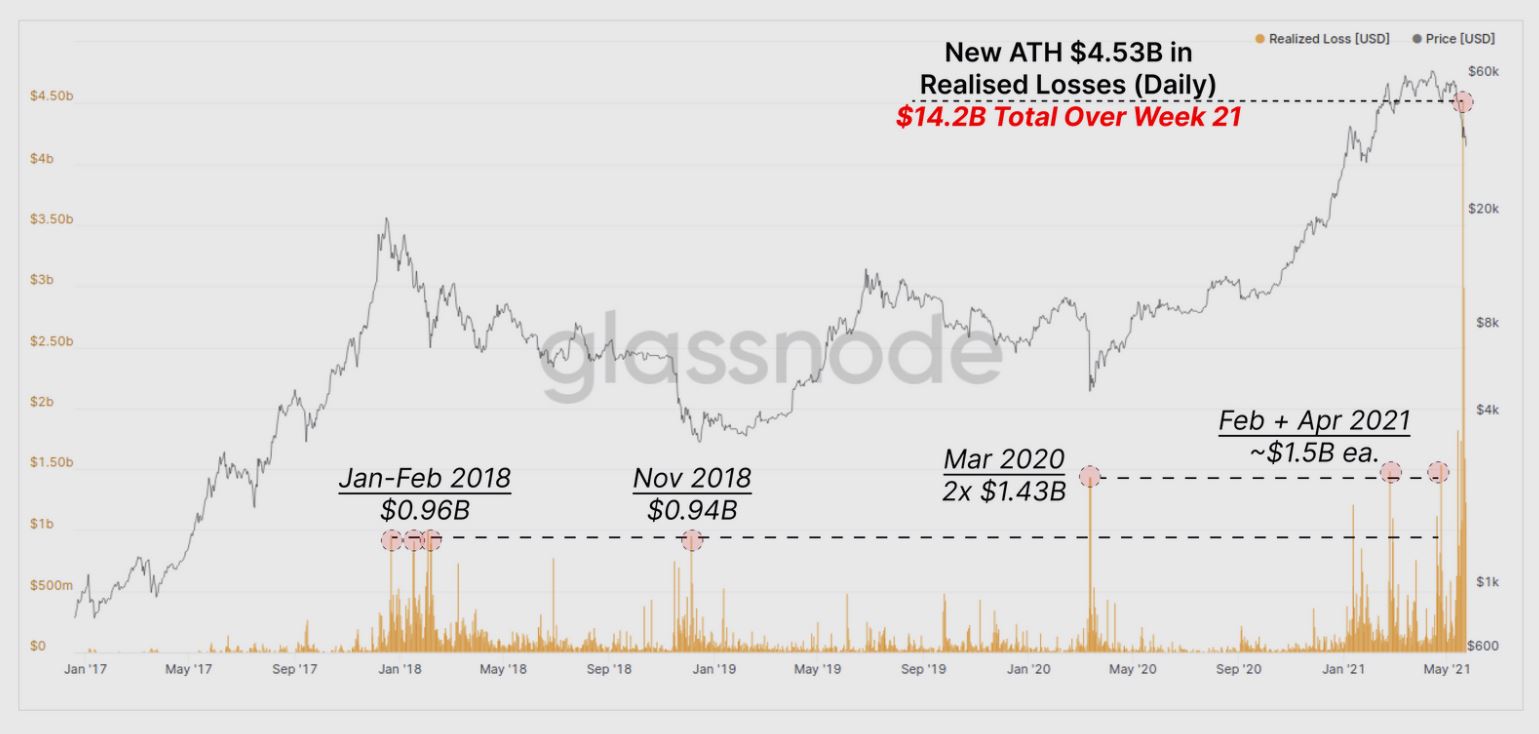
Before analyzing the reversals, it is significant to acknowledge the gravity of this capitulation event. 19 May registered the largest realized losses for Bitcoin on the daily scale at $4.5 billion. It was larger than the losses witnessed in Jan-Feb 2018 and March 2020. And yet, only 9-9.5% of the value were unrealized losses, a figure that was relatively small.
In March 2020, 44% was unrealized, whereas the magnitude was 114% back in 20218 (Unrealized losses determine the percentage that may still panic-sell in the market).
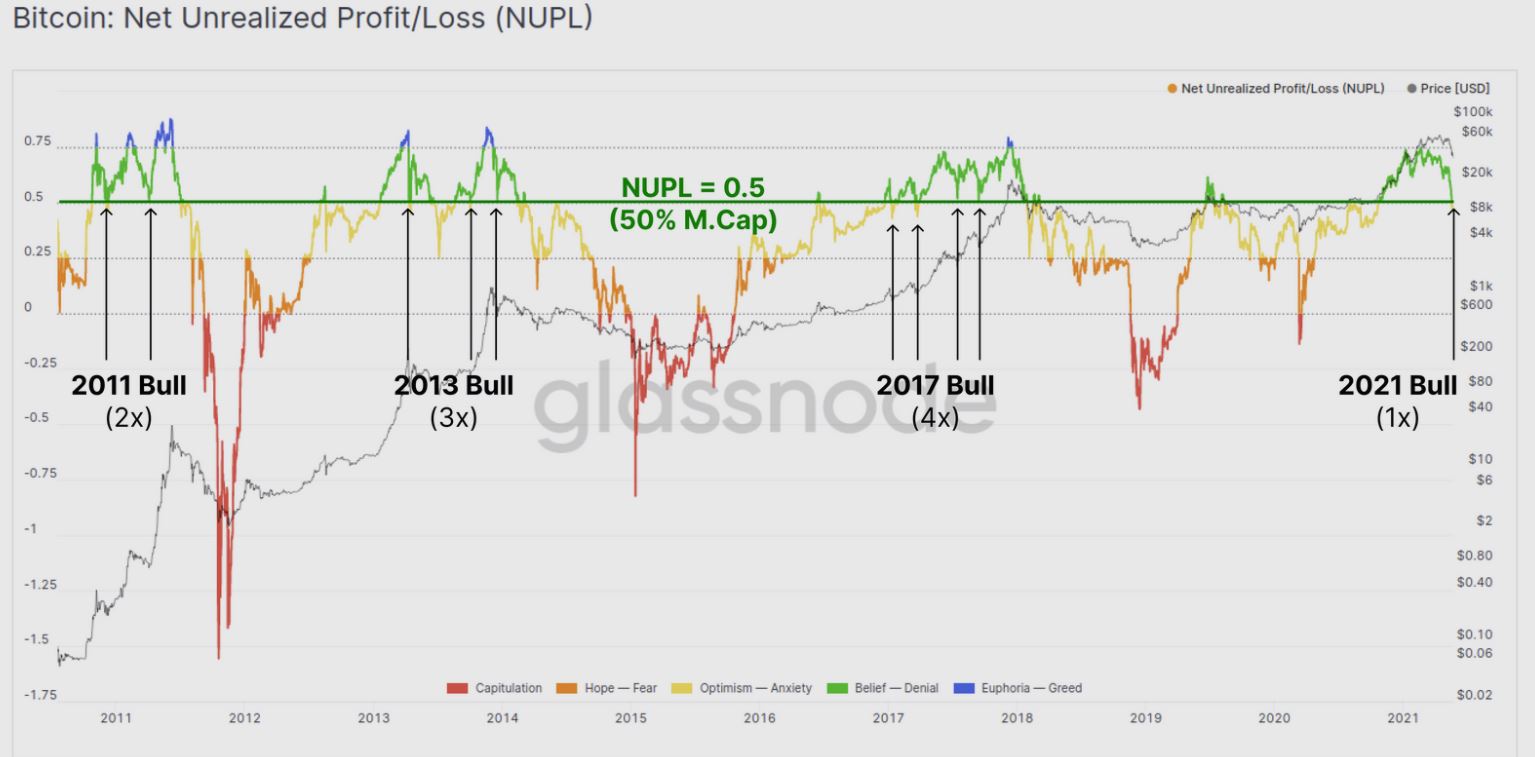
Now, one major positive that can be taken from the Net Unrealized Profit/Losses or NUPL is the re-test at the support of 0.5. According to the chart above, this particular support kickstarted multiple bullish cycles in 2013 and 2017 and presently, it is reaching the 0.5-level for the first time in 2021.
Additionally, miners did not have anything to do with the sell-off this time. During major bearish cycles in the past, miners have been responsible for strong sell-offs. This time, however, short-term holders were more responsible for extended corrections. Bitcoin Token holders between 1 month-6 month possibly chased the retail price throughout the cycle, and once the price collapsed, panic selling ensured the higher realized losses for BTC bought between $50,000-$60,000.
Higher liquidations for leverage trades also led to a short-squeeze which dragged BTC down to $30,000 for a brief moment.

Right now, the funding rates across exchanges are cooling off as well, with the selling pressure subsiding in the market. The worst could be over for now, and with the fundamentals relatively bullish, the market remains on course for a strong 2021.
In the next article, we will discuss the price market structure, with potential buying and selling zones for Bitcoin, and estimate the long-term movement for the digital asset.


