For LEO investors $5.2-$5.3 area will be a region of…

Disclaimer: The findings of the following analysis are the sole opinions of the writer and should not be considered investment advice.
Bitcoin crashed past multiple important support levels in the past two days, but in the same time period, LEO only saw a pullback on its uptrend from early June. Was this a sign of strength for LEO?
The price was trading at an important demand area at press time. Some respite for Bitcoin from the selling pressure could well see LEO soar higher on the price charts in the days to come.
LEO- 12-Hour Chart
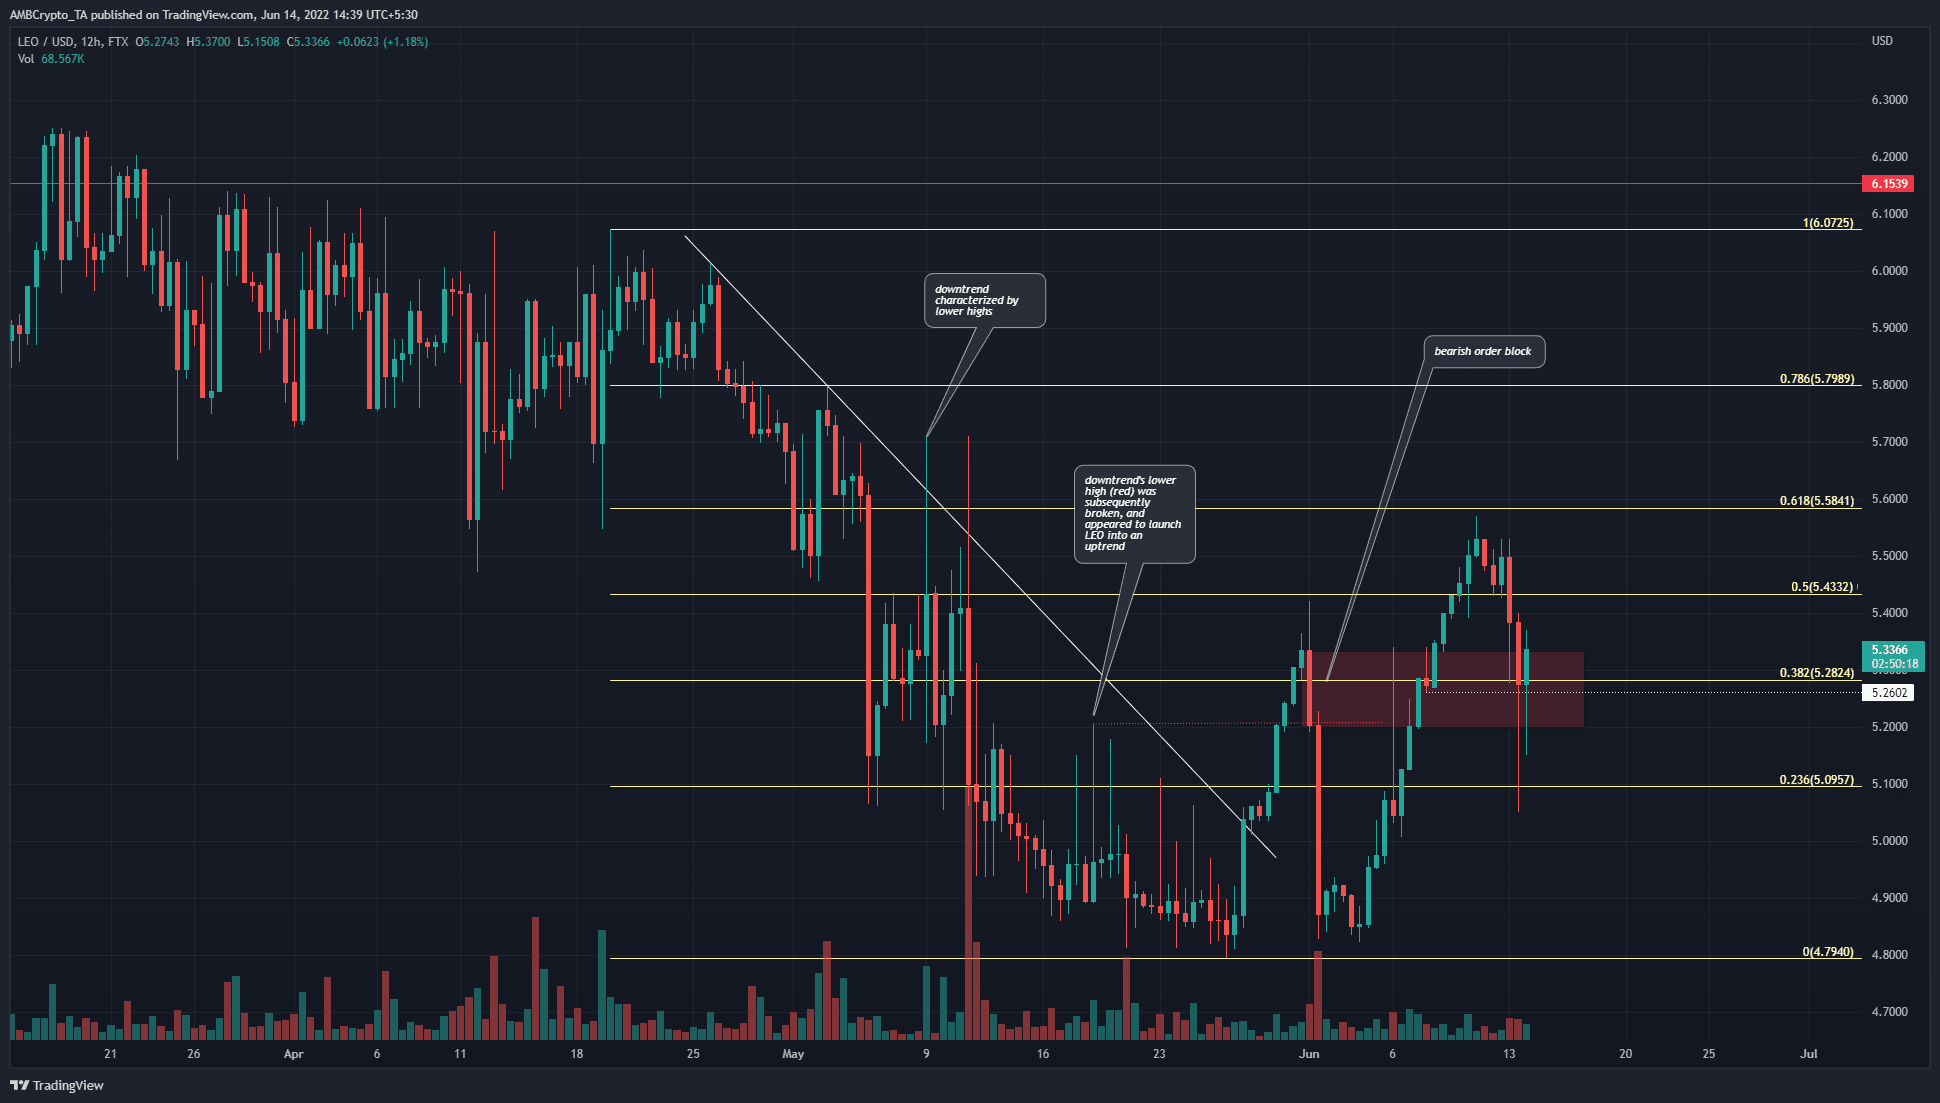
The Fibonacci retracement levels (yellow) showed that the price was above the 38.2% retracement level, however, it saw large wicks that saw LEO momentarily drop to the $5.1 mark. However, a trading session close beneath the $5.26 level, the previous higher low, wasn’t seen.
Before the gains of late May and June, LEO had been toiling in a downtrend. In the last week of May, the price broke past a lower high at $5.2 and pushed higher to $5.43, before seeing a deep pullback to $4.9. Yet, in doing so, the longer-term structure was flipped to bullish.
And, that is how it remains. From late May, the price has set higher lows. In the days to come, a session close below $5.26 could be ominous for the bulls. Similarly, if the price can push past the $5.58 level, it would likely reach $5.79 before a pullback on its uptrend.
Rationale
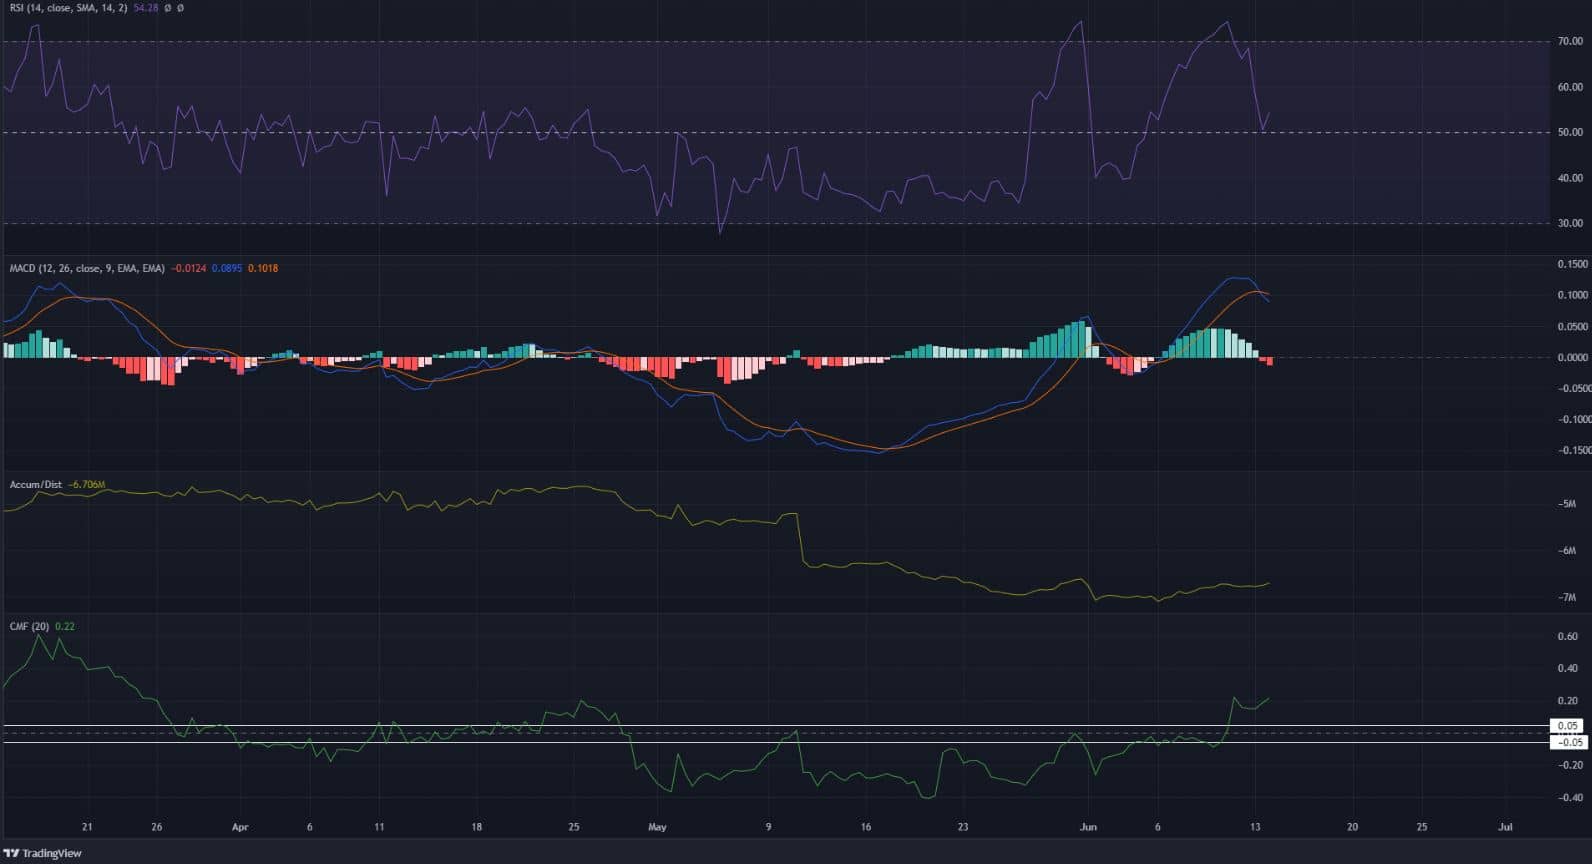
The indicators showed the asset having bullish momentum. The H12 RSI retested neutral 50 as support and appeared to be moving upwards once again, just as the price itself finds support on the previously bearish order block.
Hence, there is some suggestion that the previous supply zone has now been flipped to demand, and a move upward could be seen. The MACD was also well above the zero line, although it formed a bearish crossover to indicate a pullback.
The A/D, on the other hand, has been on a steady downtrend and showed that the selling volume has been heavy. The CMF has also been below -0.05 in the month of May, to denote significant selling pressure. However, the CMF managed to climb back above +0.05, while the A/D moved sideways on the charts.
Conclusion
The indicators were not in agreement- although momentum was with the bulls, there was not steady nor significant buying pressure to sustain a rally upward. The $5.2-$5.3 area remains a region of demand. Despite the lack of demand, LEO could push higher once more.


