Lido reclaims top DeFi TVL spot; here’s what caused the rally

- Lido experienced a drop in TVL in previous days partly due to a fall in the value of LDO.
- LDO rallied by over 9% in recent days to help Lido become the top DeFi platform.
Lido recently disclosed a decrease in its Total Value Locked (TVL), the potential contributing factor was a decline in the value of its native token LDO.
Before a modest decline, the staking platform had been the leading Decentralized Finance (DeFi) platform. However, DefiLlama’s recent data hinted at a shift in the staking protocol’s TVL’s fortune. Now, the question is- What may have caused this most recent development?
The ups and downs of Lido’s TVL
There had been a change in the volume of Total Value Locked of Lido Finance, as per statistics collected from DefiLlama.
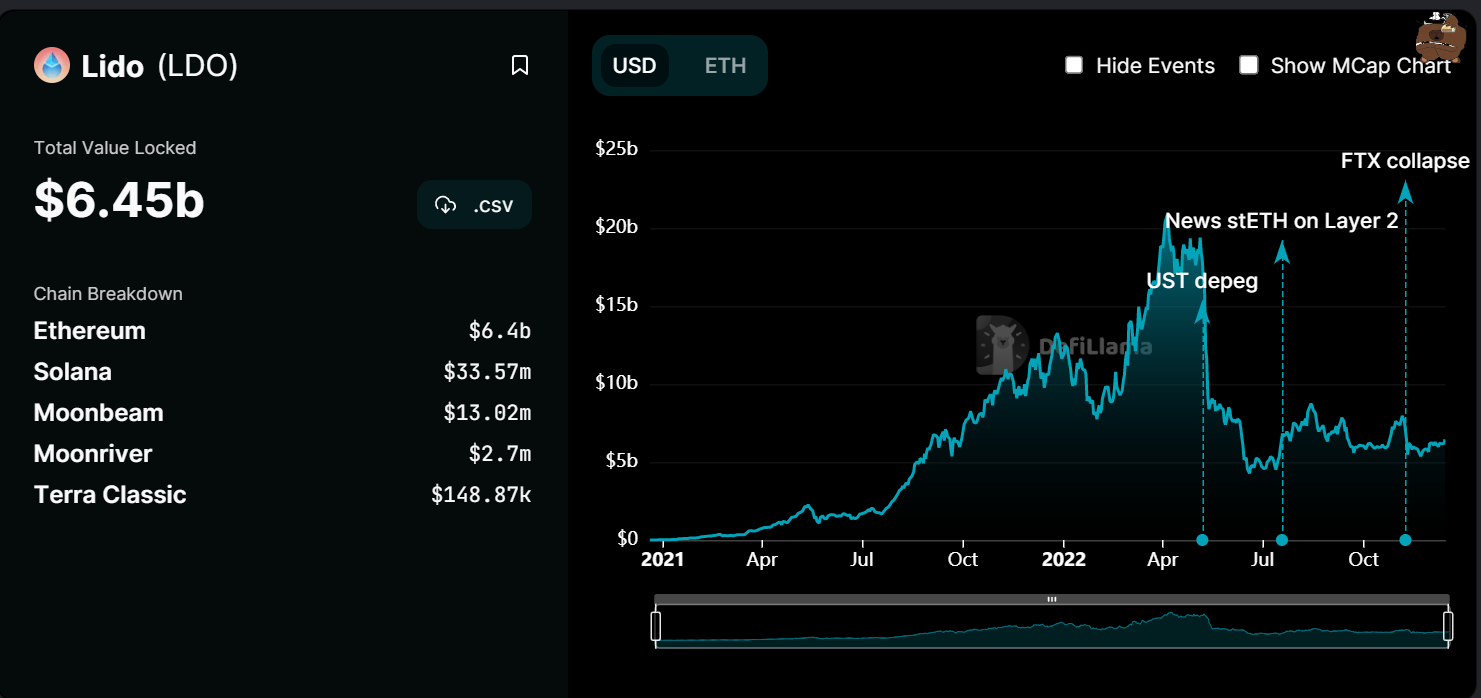
In the last 24 hours, the staking platform’s TVL climbed by more than 3%, and over the past 30 days, it increased by about 8%. With a TVL of $6.45 billion as of this writing, it was effectively the top DeFi platform.
A second look at Lido’s TVL revealed that two significant events that shook the crypto world had a detrimental effect on the platform. The platform’s TVL was over $18 billion before Terra’s collapse.
However, this value fell massively as a result of the collapse. The most recent adverse effect was the FTX collapse, which also caused the TVL value to decline from almost $8 billion to $6.45 billion, at press time.
LDO’s price causes TVL rally
The decline in the value of LIDO’s native token, LDO, was one of the factors Lido identified for the initial decline in TVL.
A daily timeframe assessment of the price of LDO revealed that the asset had increased. It rose by approximately 10% over the previous 72 hours. Additionally, it was evident from the trading period under observation, at the time of this writing, that it was trading at a profit of more than 1%.
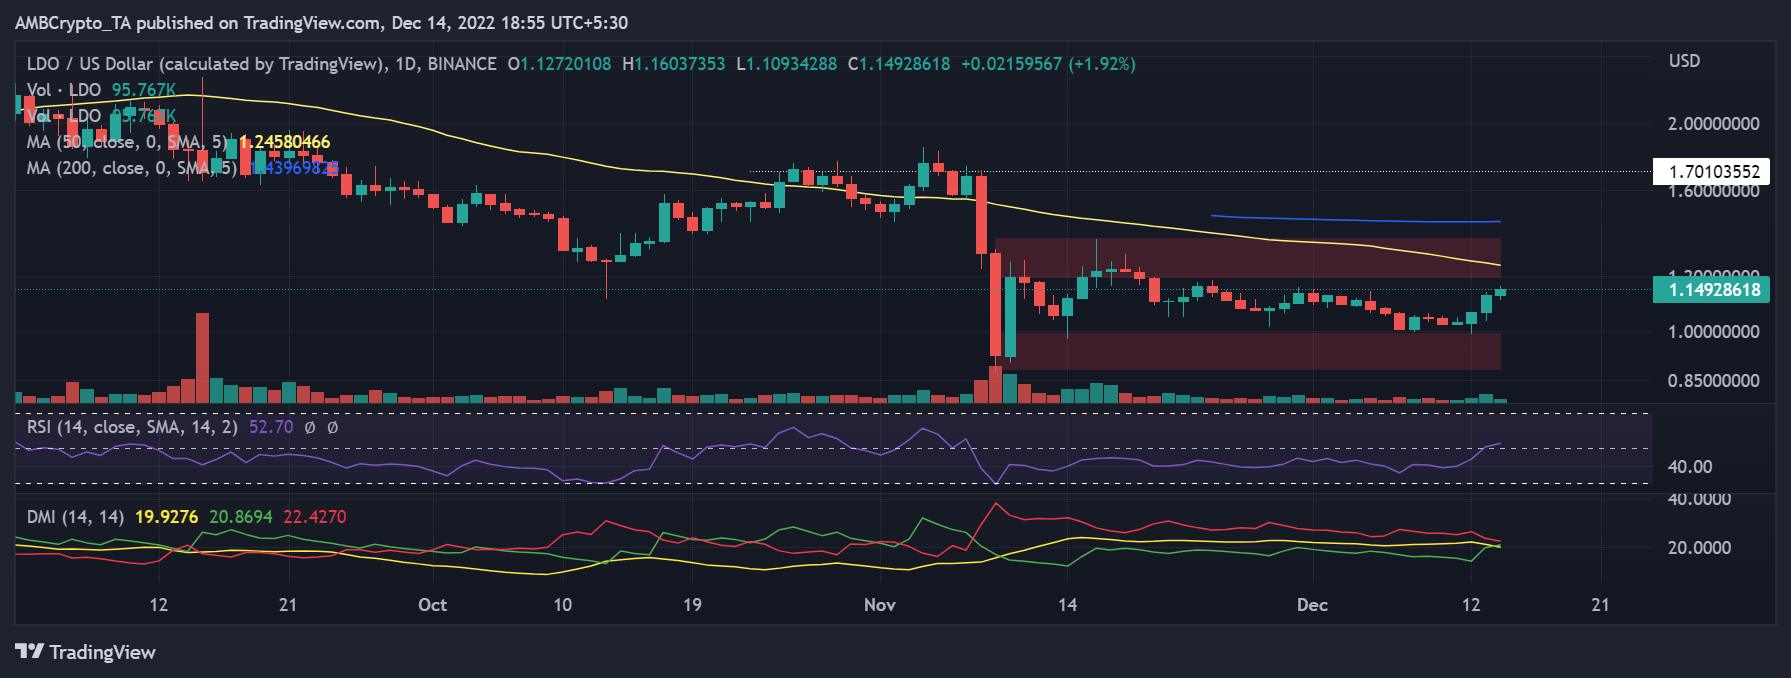
The short Moving Average’s (yellow line) location indicated that the price was not in a strong trend. The location of the Relative Strength Index (RSI) line indicated that LDO had entered a bullish trend due to the recent spike.
But when the RSI and yellow line were combined, it was clear that, while bullish, the trend could have been stronger. The yellow line also functioned as a region of resistance for the token at about $1.2. A further upward trend is possible if it breaks through this resistance level.
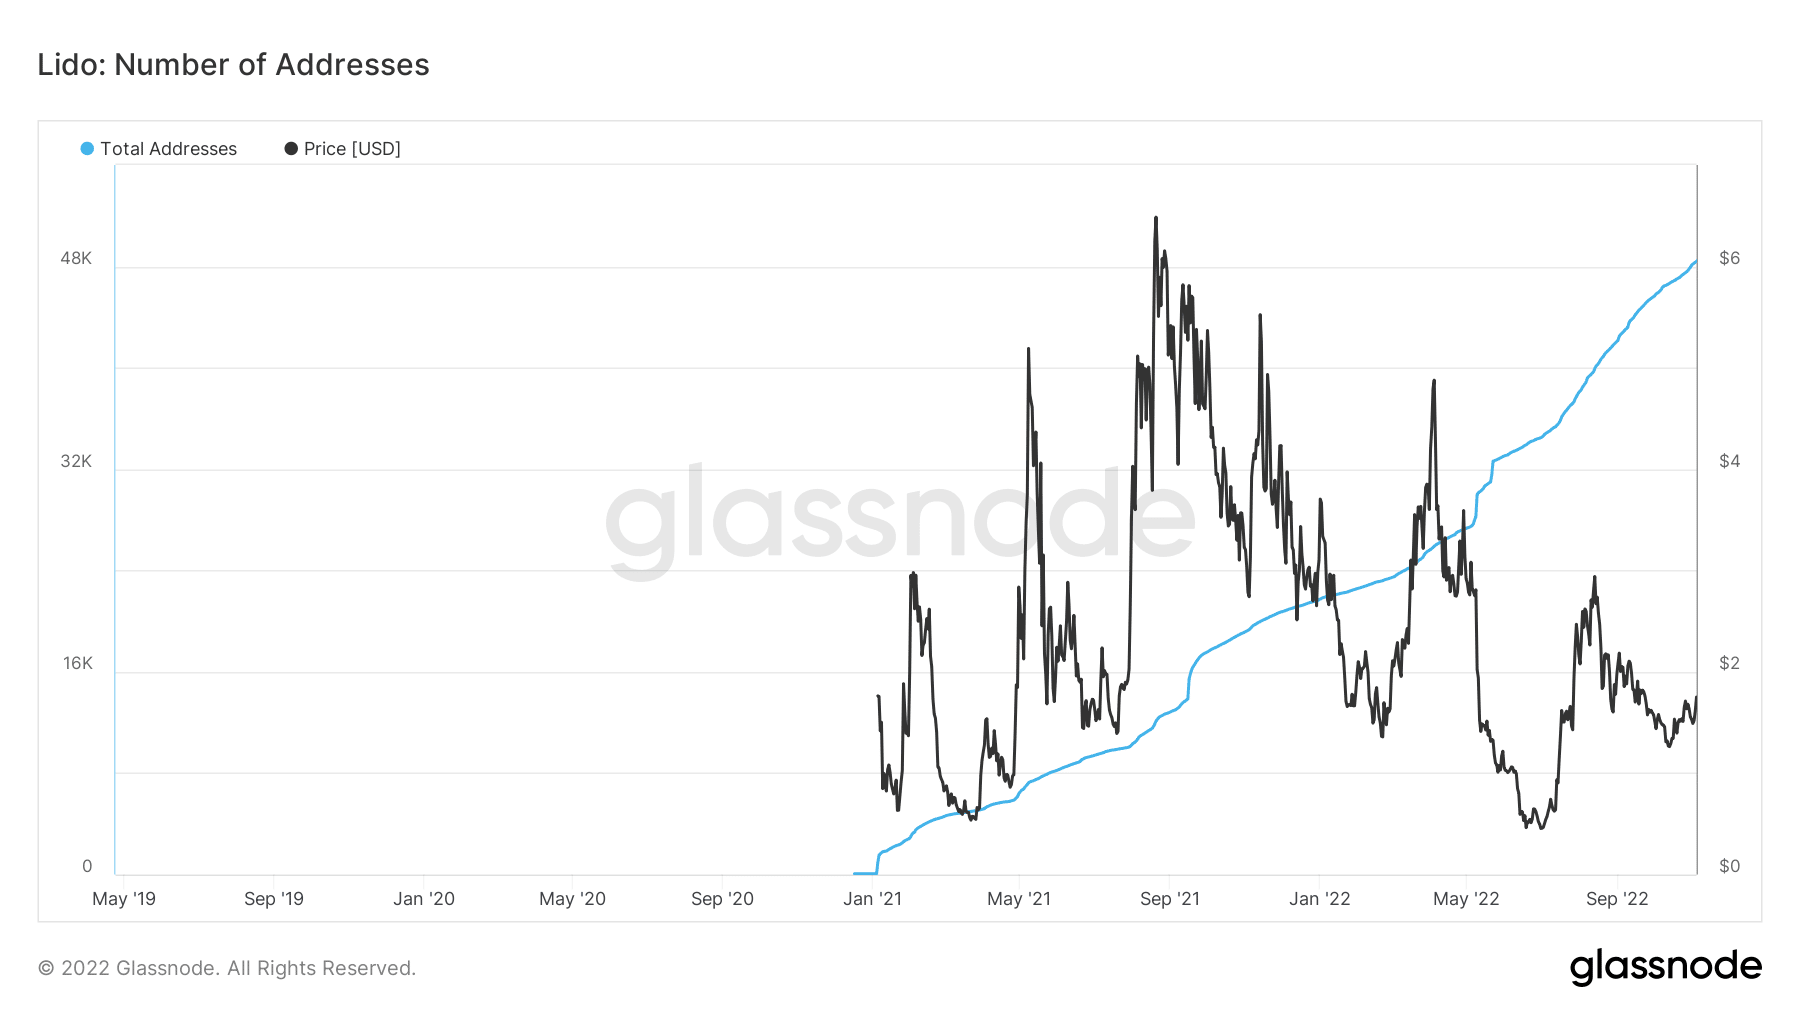
Total address metrics on the rise
The trajectory of Glassnode’s Total Address metric can be used to infer information about how Lido has evolved. The overall number of addresses registered on the network was more than before, according to the total address count. As of the time of writing, more than 49,000 addresses could be seen.