What LINK’s momentary bounce means for its downtrend

Disclaimer: The findings of the following analysis are the sole opinions of the writer and should not be considered investment advice
Last week, a close look at on-chain metrics suggested that investors could be losing faith in Chainlink. Mid-March had seen investors exit the market and on-chain transactions drop, yet the price of the token had advanced steadily to a zone of resistance at $17.5. In the past week, Chainlink has dropped back to the $13.5 support level. Now, the question is- Over the next few hours, will a wave of selling be initiated once more?
LINK- 1 Hour Chart
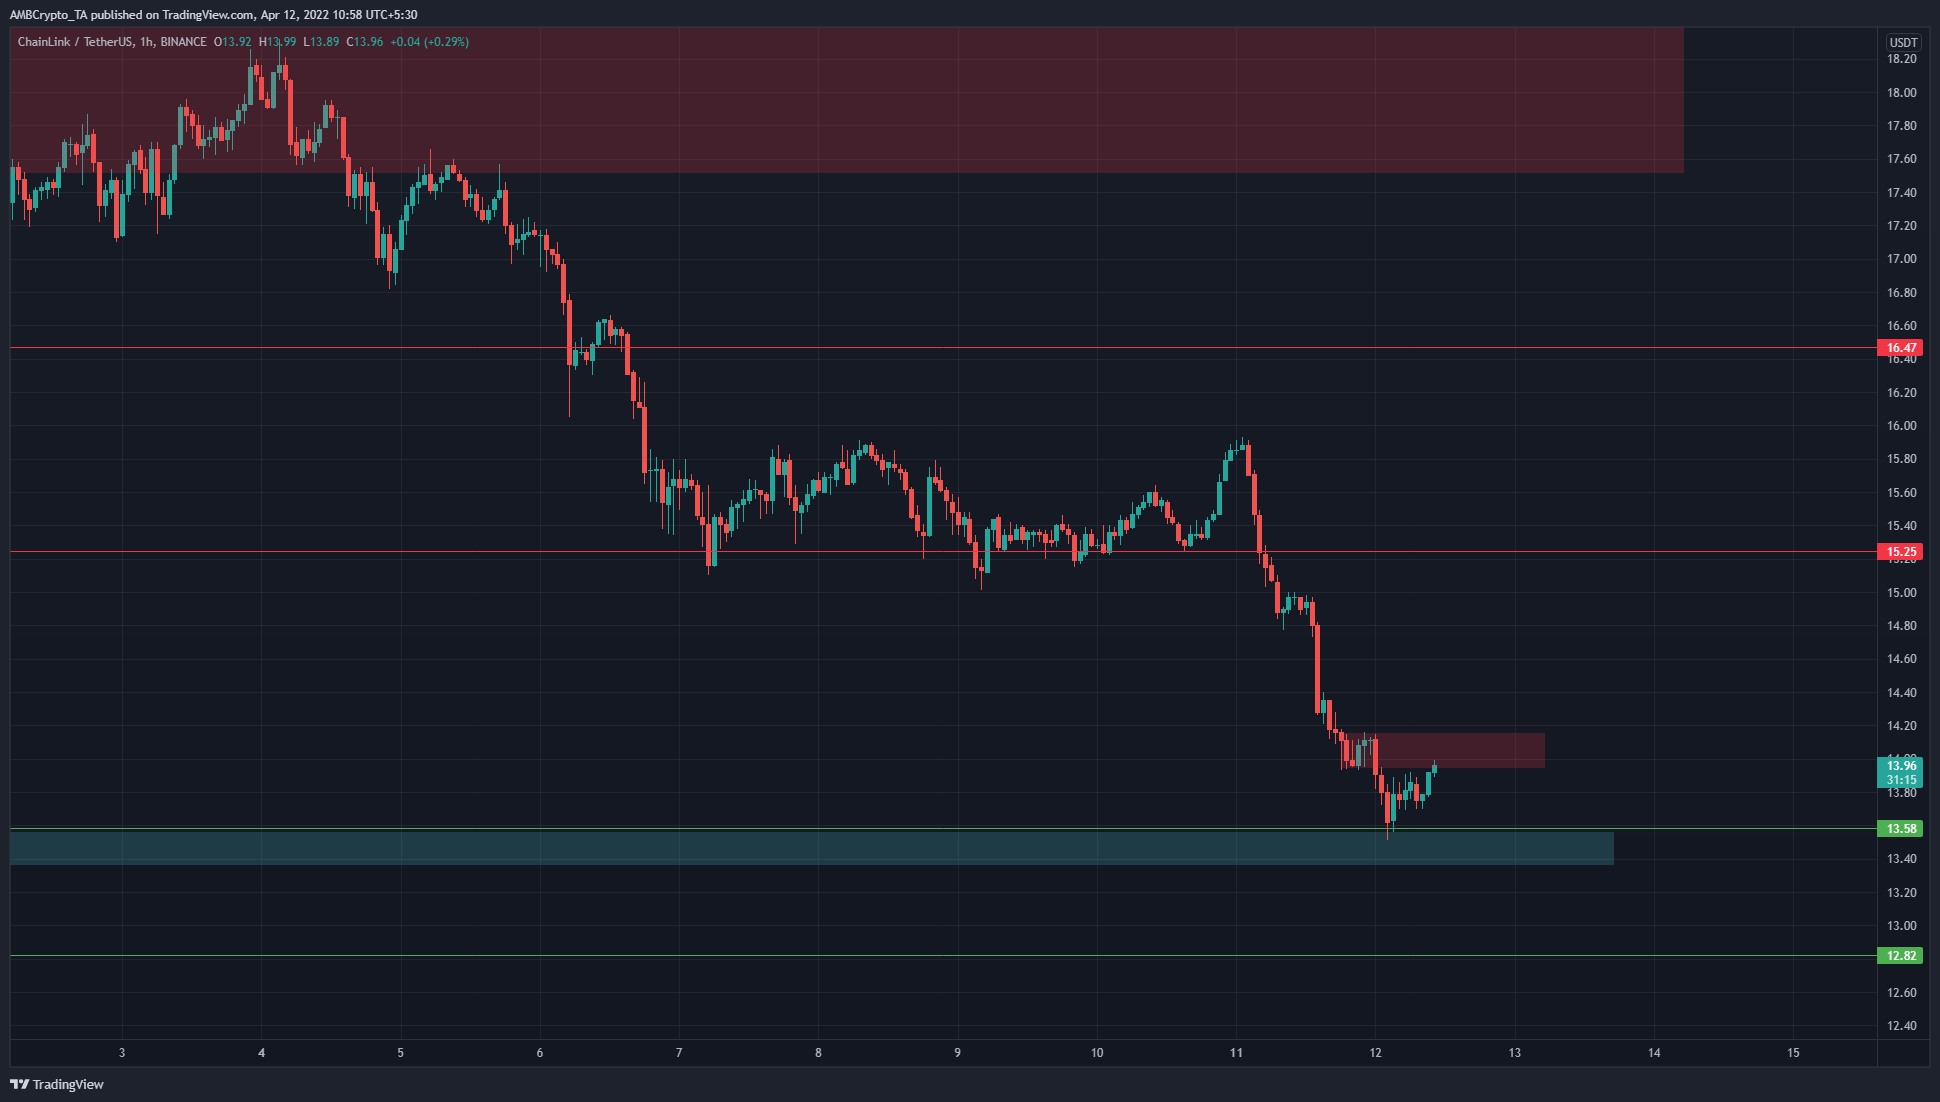
Bitcoin’s strong losses the previous day meant that volatility was imminent, as oversold conditions on lower timeframes could see contrarian traders drive prices higher in search of liquidity. For LINK, there were two such zones of liquidity where a selling or shorting opportunity might arise.
The first and closest one was the $13.95-$14.15 area (red box). Doji candlesticks or large upper wicks could show the presence of strong sellers. If LINK is able to push higher and flip $13.95 to short-term support, the $14.85-$15.1 area would be worth watching. With confluence from horizontal resistance at $15.25 as well, sellers could make a stand here.
In either scenario, imminent volatility could present risks to both buyers and sellers in the short term.
Rationale
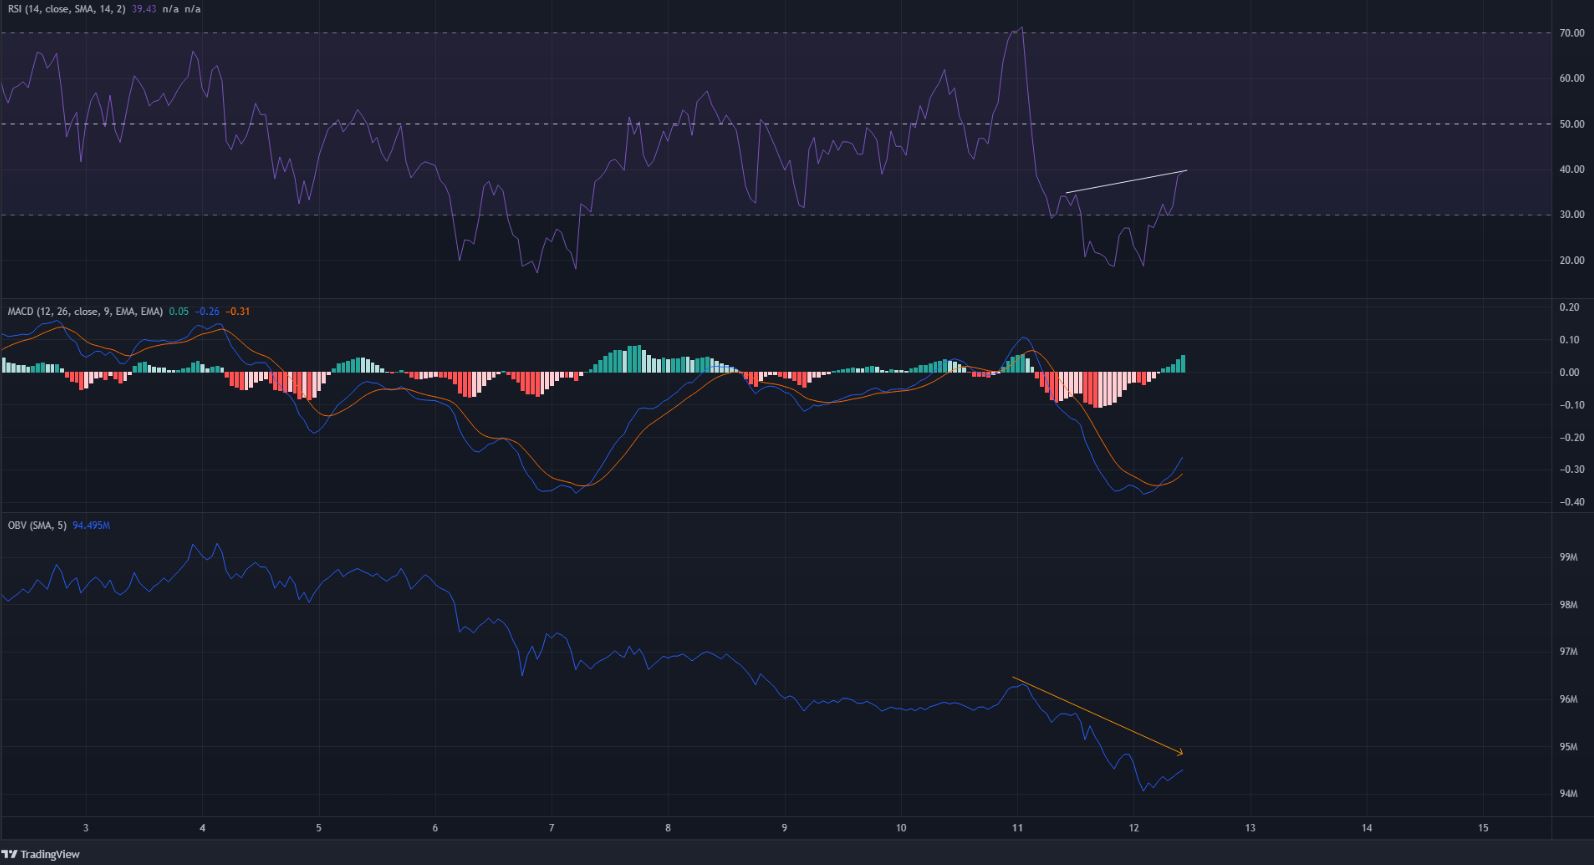
The RSI formed a higher high even as the price appeared on course to form a lower high. This hidden bearish divergence could be an early signal of the end of the bounce for LINK. The MACD also formed a bullish crossover beneath the zero line. A short opportunity could arise once the MACD line forms a bearish crossover beneath the signal line.
To support the bearish bias, the OBV has been in a downtrend for the past ten days. Moreover, the recent bounce did not have extraordinary buying volume. This meant that the former downward move could resume.
Conclusion
The market structure continued to be bearish on the shorter timeframes, and a move past $14.2 would be necessary to flip this bias. The $14.8-$15.3 could pose resistance, and rejection from there could offer a selling opportunity. Conversely, if Bitcoin can climb past $42k and LINK past $15.3, the bulls would be emboldened.


