Litecoin, Augur, VeChain Price Analysis: 27 December

Both Litecoin and Vechain registered strong bullish momentum on the price charts. Litecoin rose past its previous local high at $124 and the bulls targeted the $145-mark. VET broke to the downside of an ascending triangle pattern, but it recovered backed by good trading volume and it could test the $0.0178-resistance level once more. Finally, Augur traded within a range over the past couple of days and showed some levels of interest for scalp trades.
Litecoin [LTC]
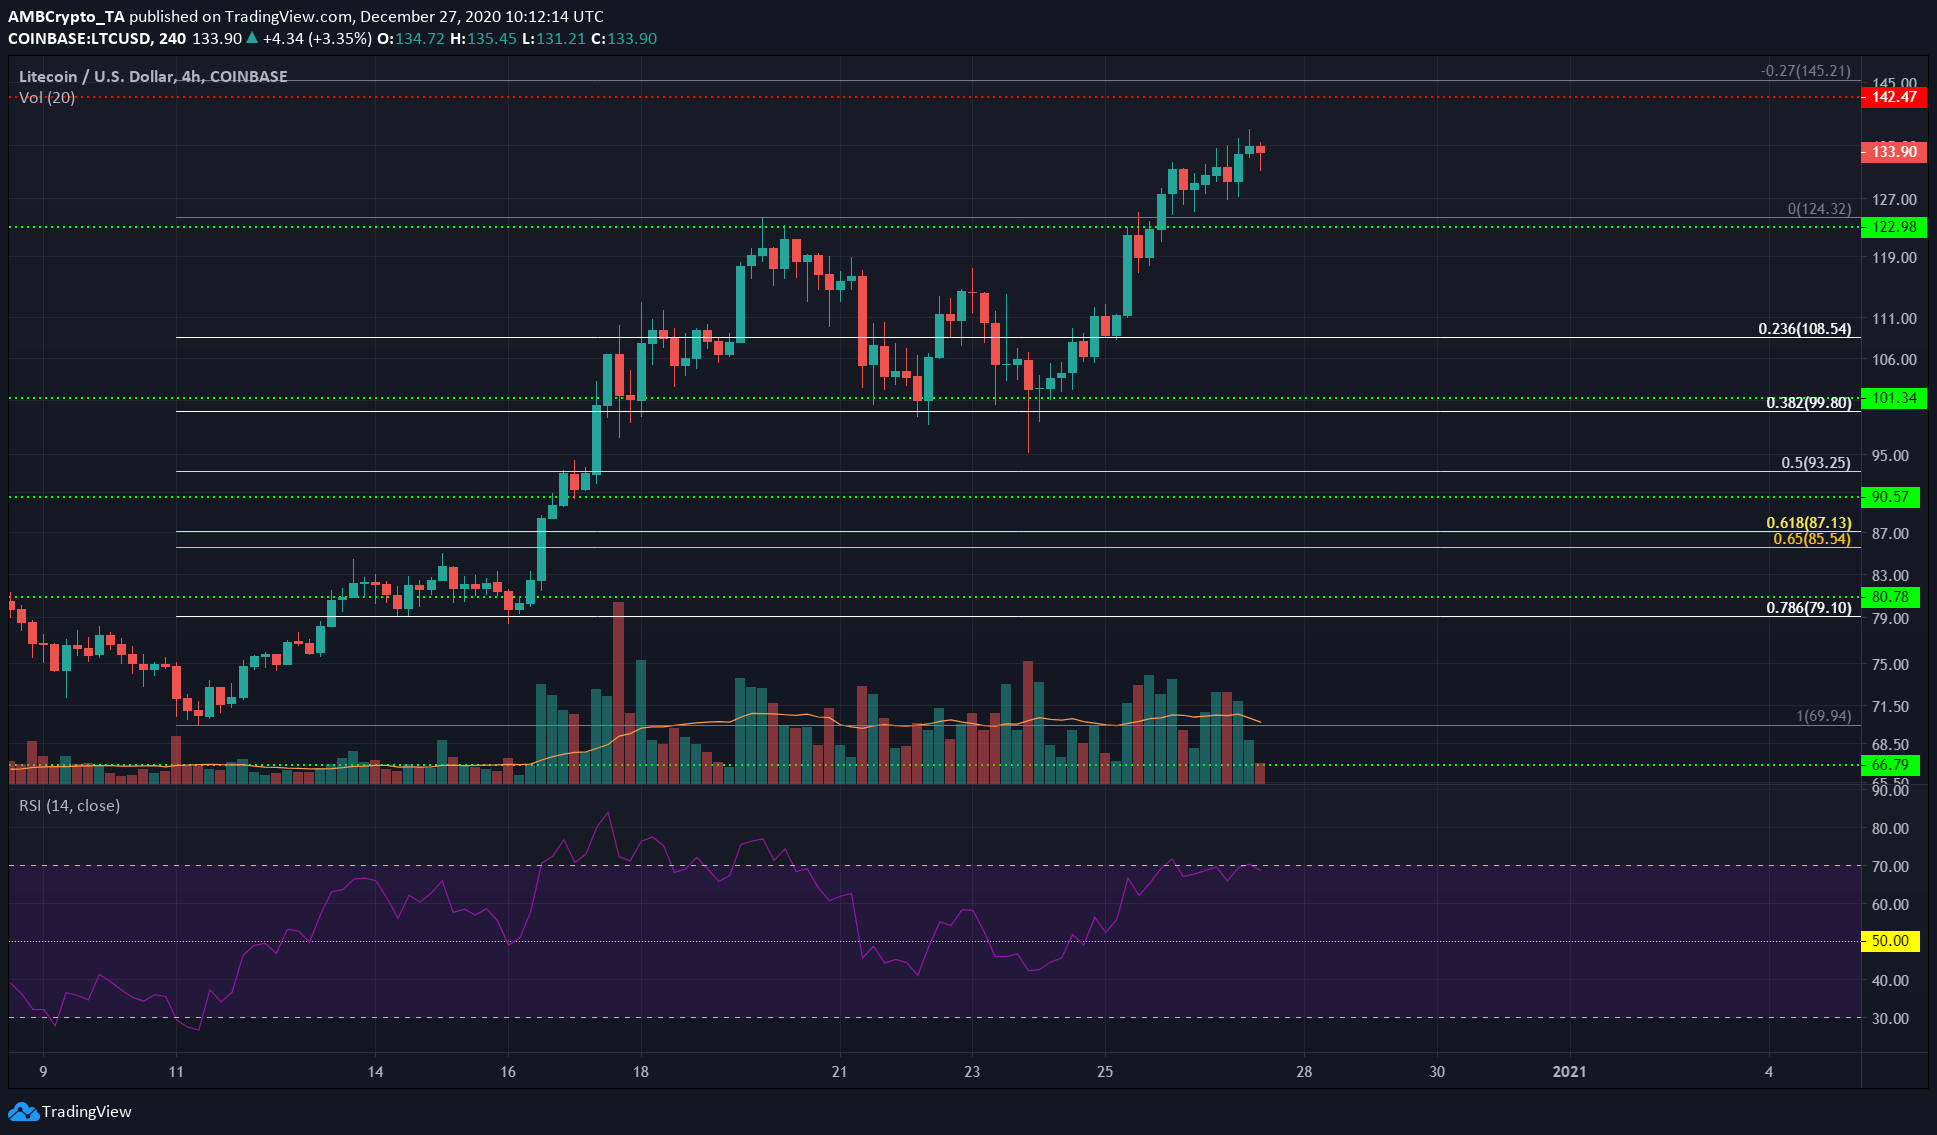
Litecoin rose past the $122-level once more and it was heading to the 27% Fibonacci extension level at $145. With the $142-level of resistance close by, it would prove to be a strong level of resistance if LTC tests it in the coming days.
The RSI was at 70 and on the threshold of crossing into the overbought zone. However, this did not suggest an immediate pullback for the price by itself. It did, however, indicate strong bullish momentum behind LTC.
The test of the 38.2% retracement level and a surge past its local high over the past week was a development that was strongly bullish and the Fibonacci extension has shown some target levels for the bulls as well.
Augur [REP]
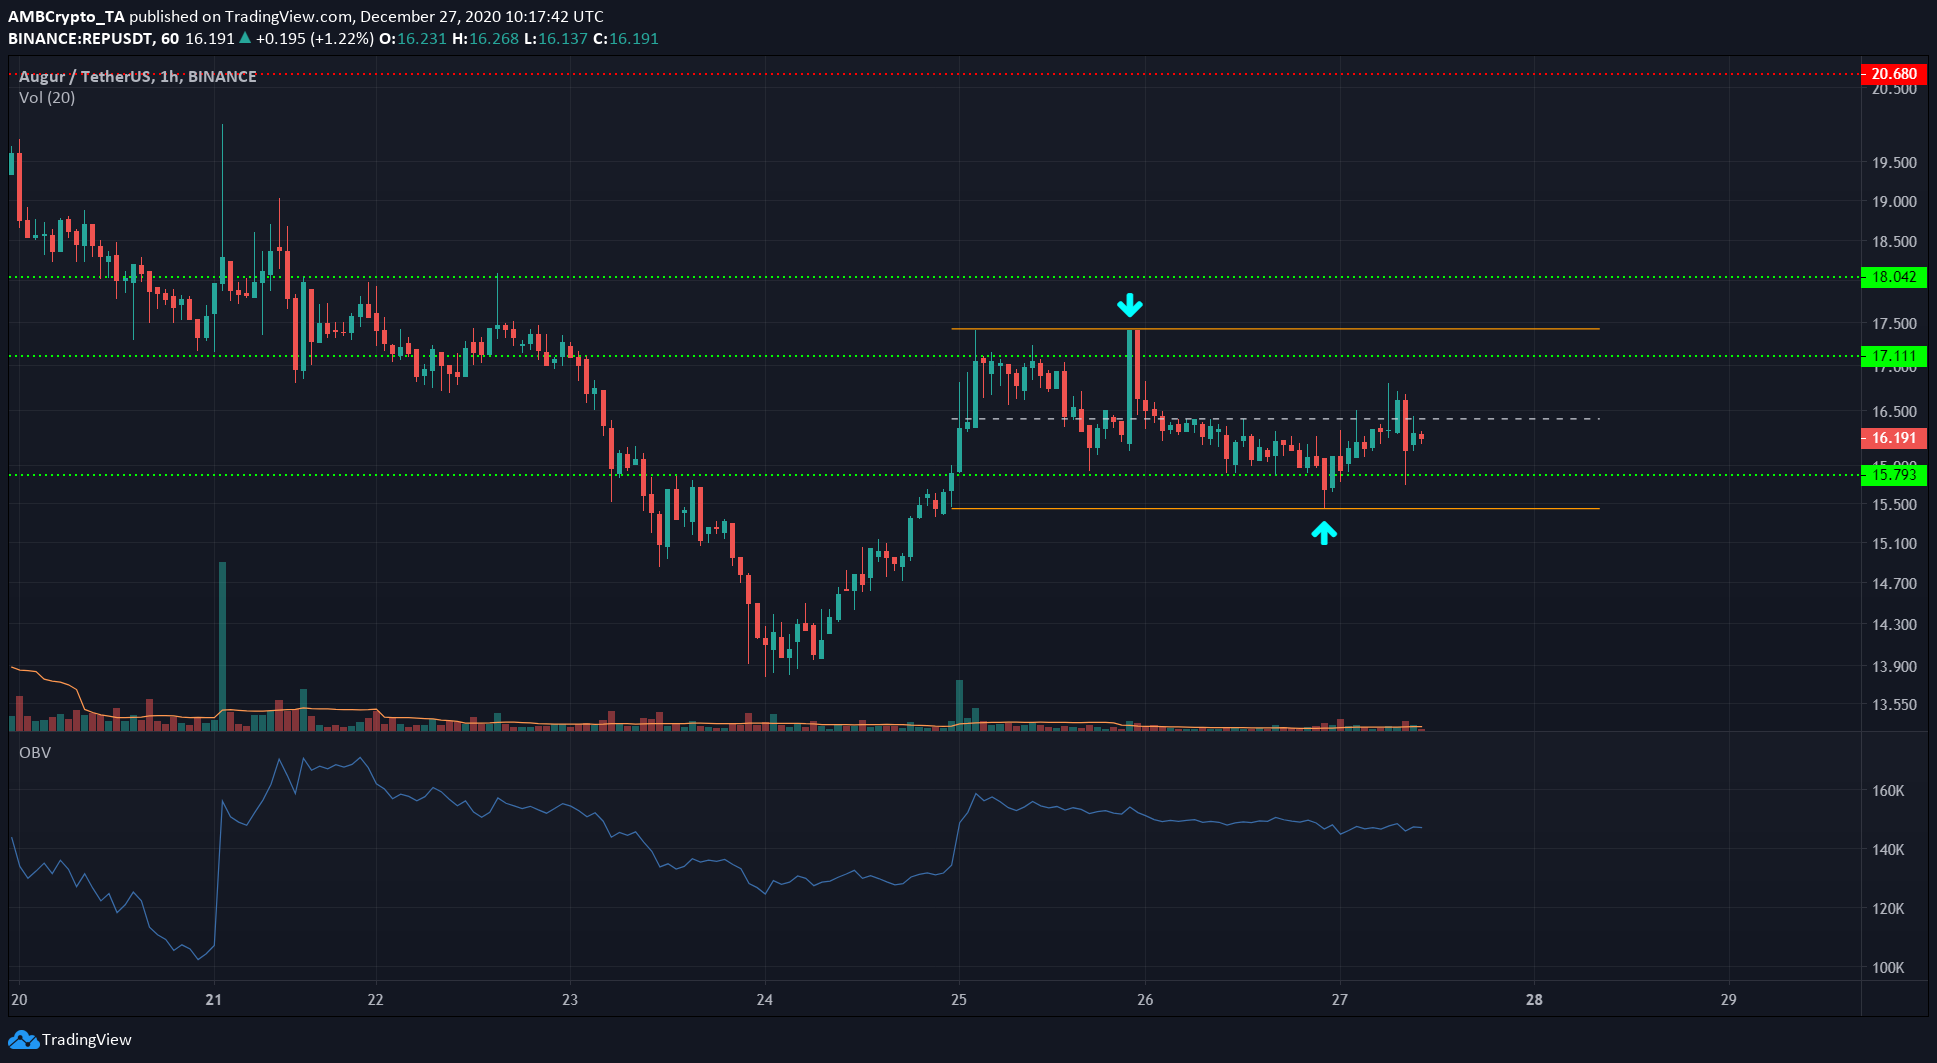
After dipping as low as $13.8, REP recovered somewhat and indicated that it had formed a range on the 1-hour chart. The upper and lower boundaries of this range were at $$17.42 and $15.44, with horizontal levels of support and resistance closeby at $15.79 and $17.11.
The mid-point of this range can be used to gauge the momentum behind REP in the short-term. At the time of writing, the price was just under the mid-point after seeing an ascent above and a sharp rejection to the downside of the mid-point.
The price tested the $15.7-support and was heading higher once more, pointing to a move past the mid-point and towards higher ranges.
There was no indication of a breakout from the range yet, however. The OBV was conspicuously flat, suggesting an equilibrium between buyers and sellers.
VeChain [VET]
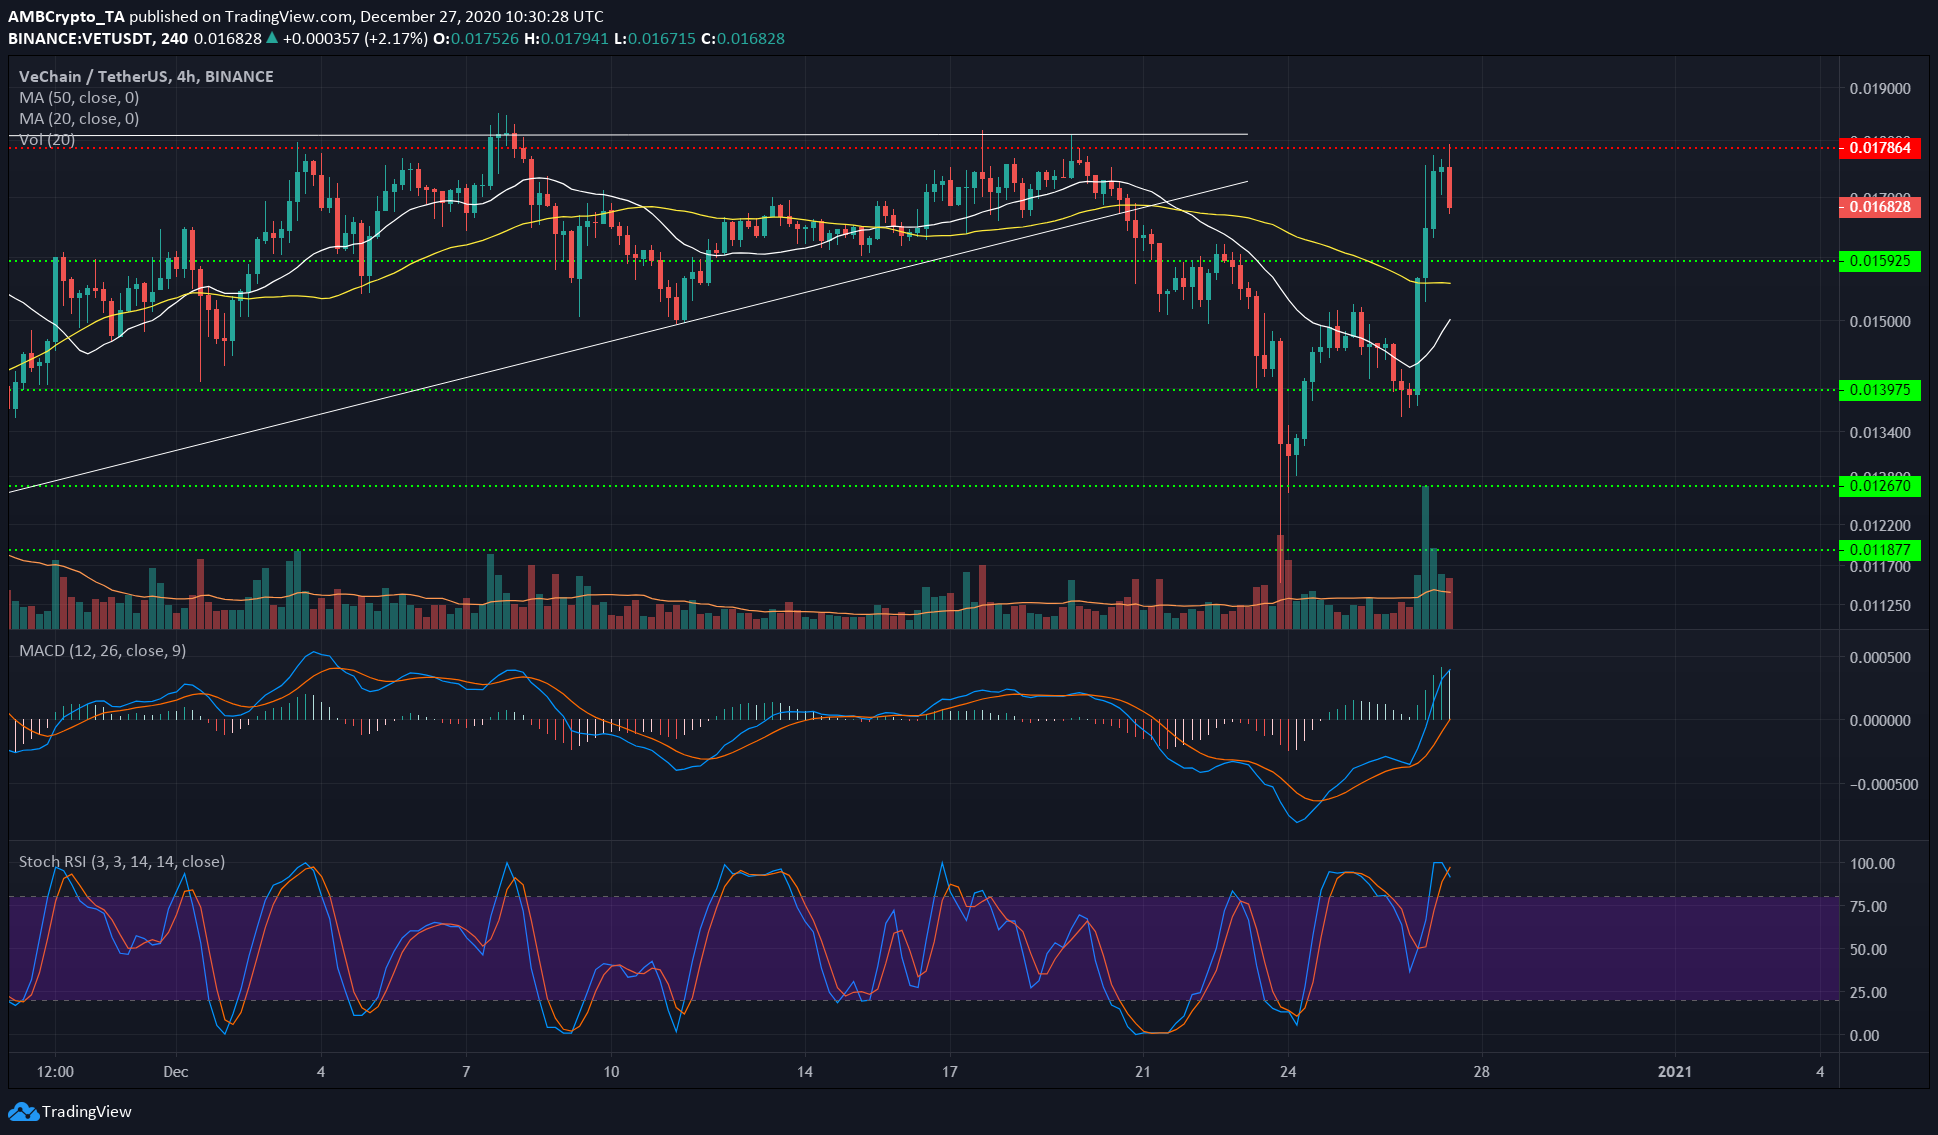
The MACD and Signal lines were some distance apart, while the Stochastic RSI also extended into the overbought region and formed a bearish crossover on the 4-hour chart.
This suggested that VET could see a minor pullback on the charts. The level of support at $0.0159 was just above the 50 SMA (yellow) and this confluence could be tested before another move to the upside.
The recovery after the drop to $0.0126 has been strong and was accompanied by above-average trading volume, signaling the bullish strength behind VET.