Litecoin, Compound, Cosmos Price Analysis: 05 February

Litecoin moved above the $150 mark once more after a minor correction that saw its price dip to $141. Compound could see a short-term bearish scenario unfold over the coming hours, while Cosmos showed rising bullish momentum as it approached $10.
Litecoin [LTC]
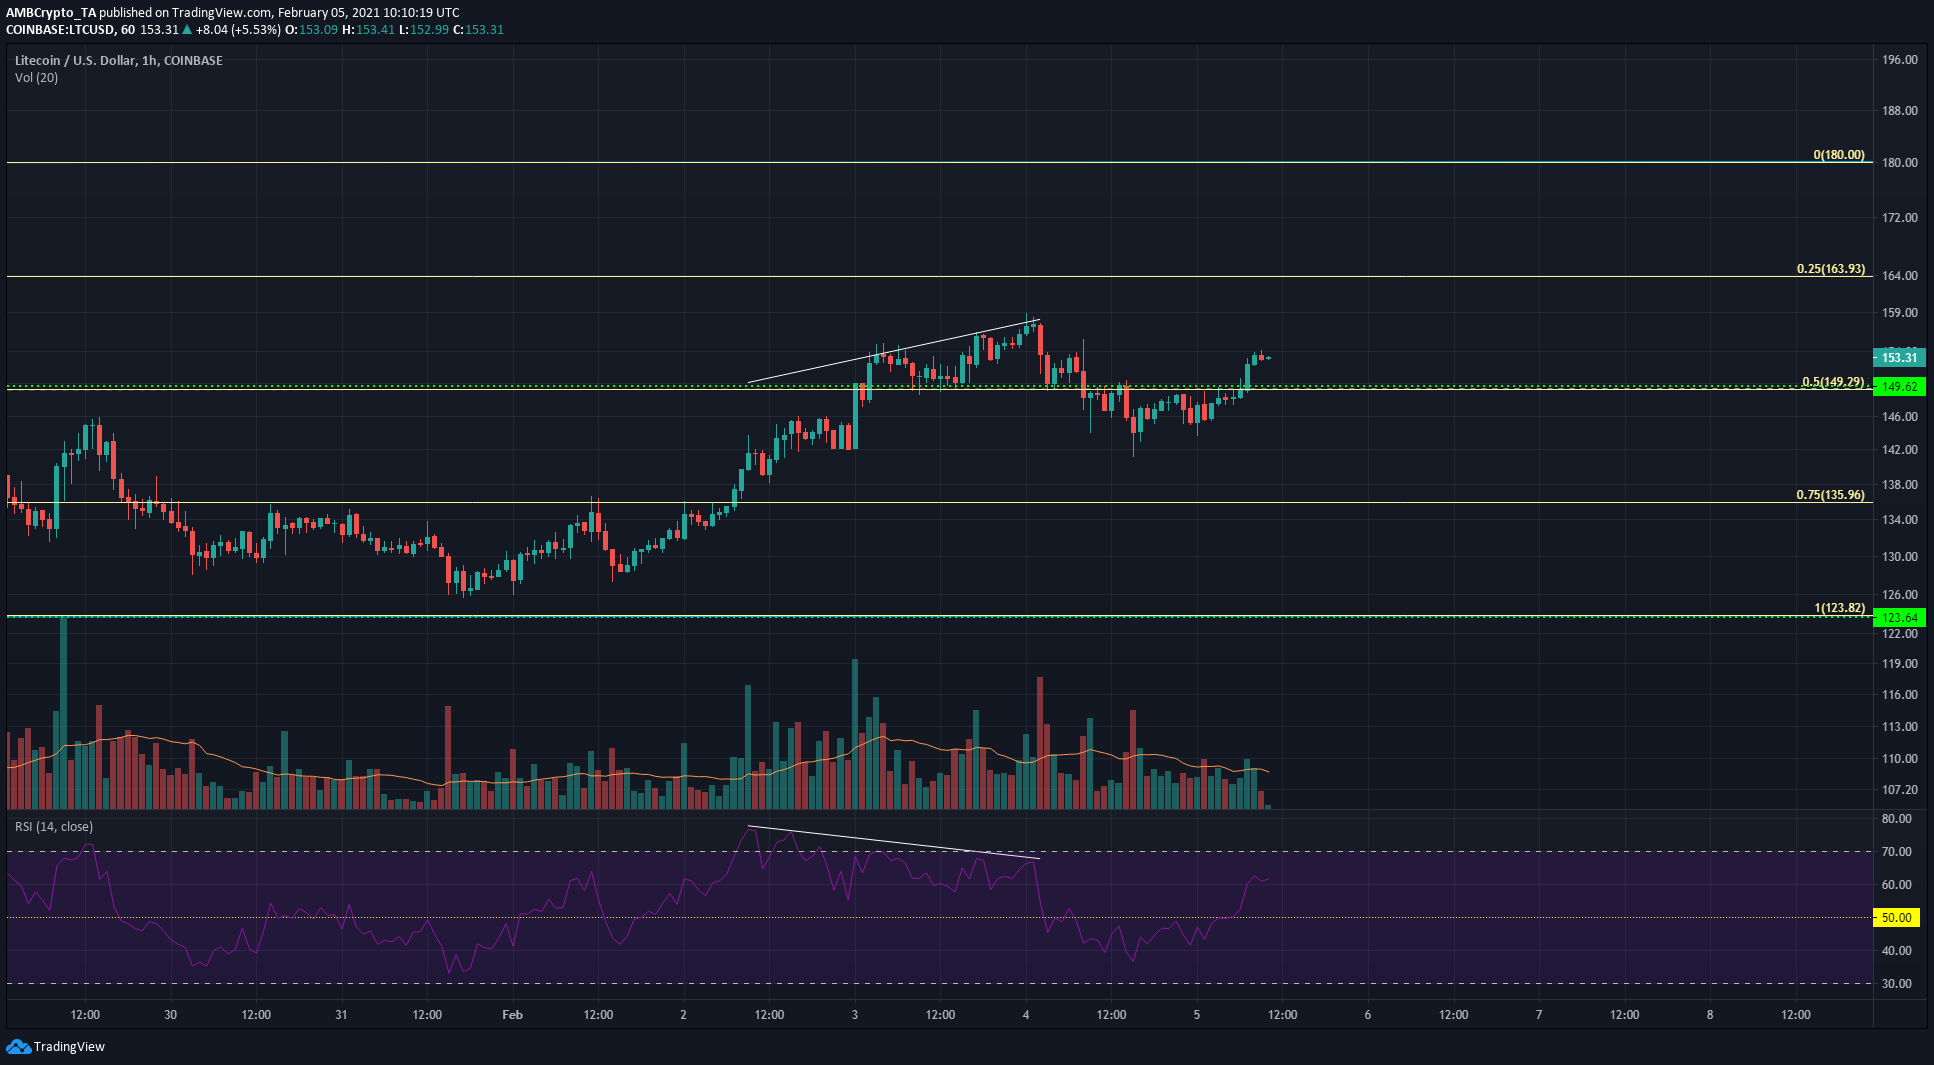
On the hourly chart, LTC had shown a bearish divergence even as LTC moved above $150. This caused a correction and saw LTC dip back toward $140 before resuming its upward move once more.
This lower timeframe indicated that the correction is over and bullish momentum was in the driver’s seat once more. The RSI climbed back above neutral 50 while the price surmounted the $150 level as well. Trading volume was noticeable but not extraordinary.
LTC has been trading within $123 to $180 since late December, and moving past the 50% level of the range makes the range highs a medium-term target for LTC bulls.
Compound [COMP]
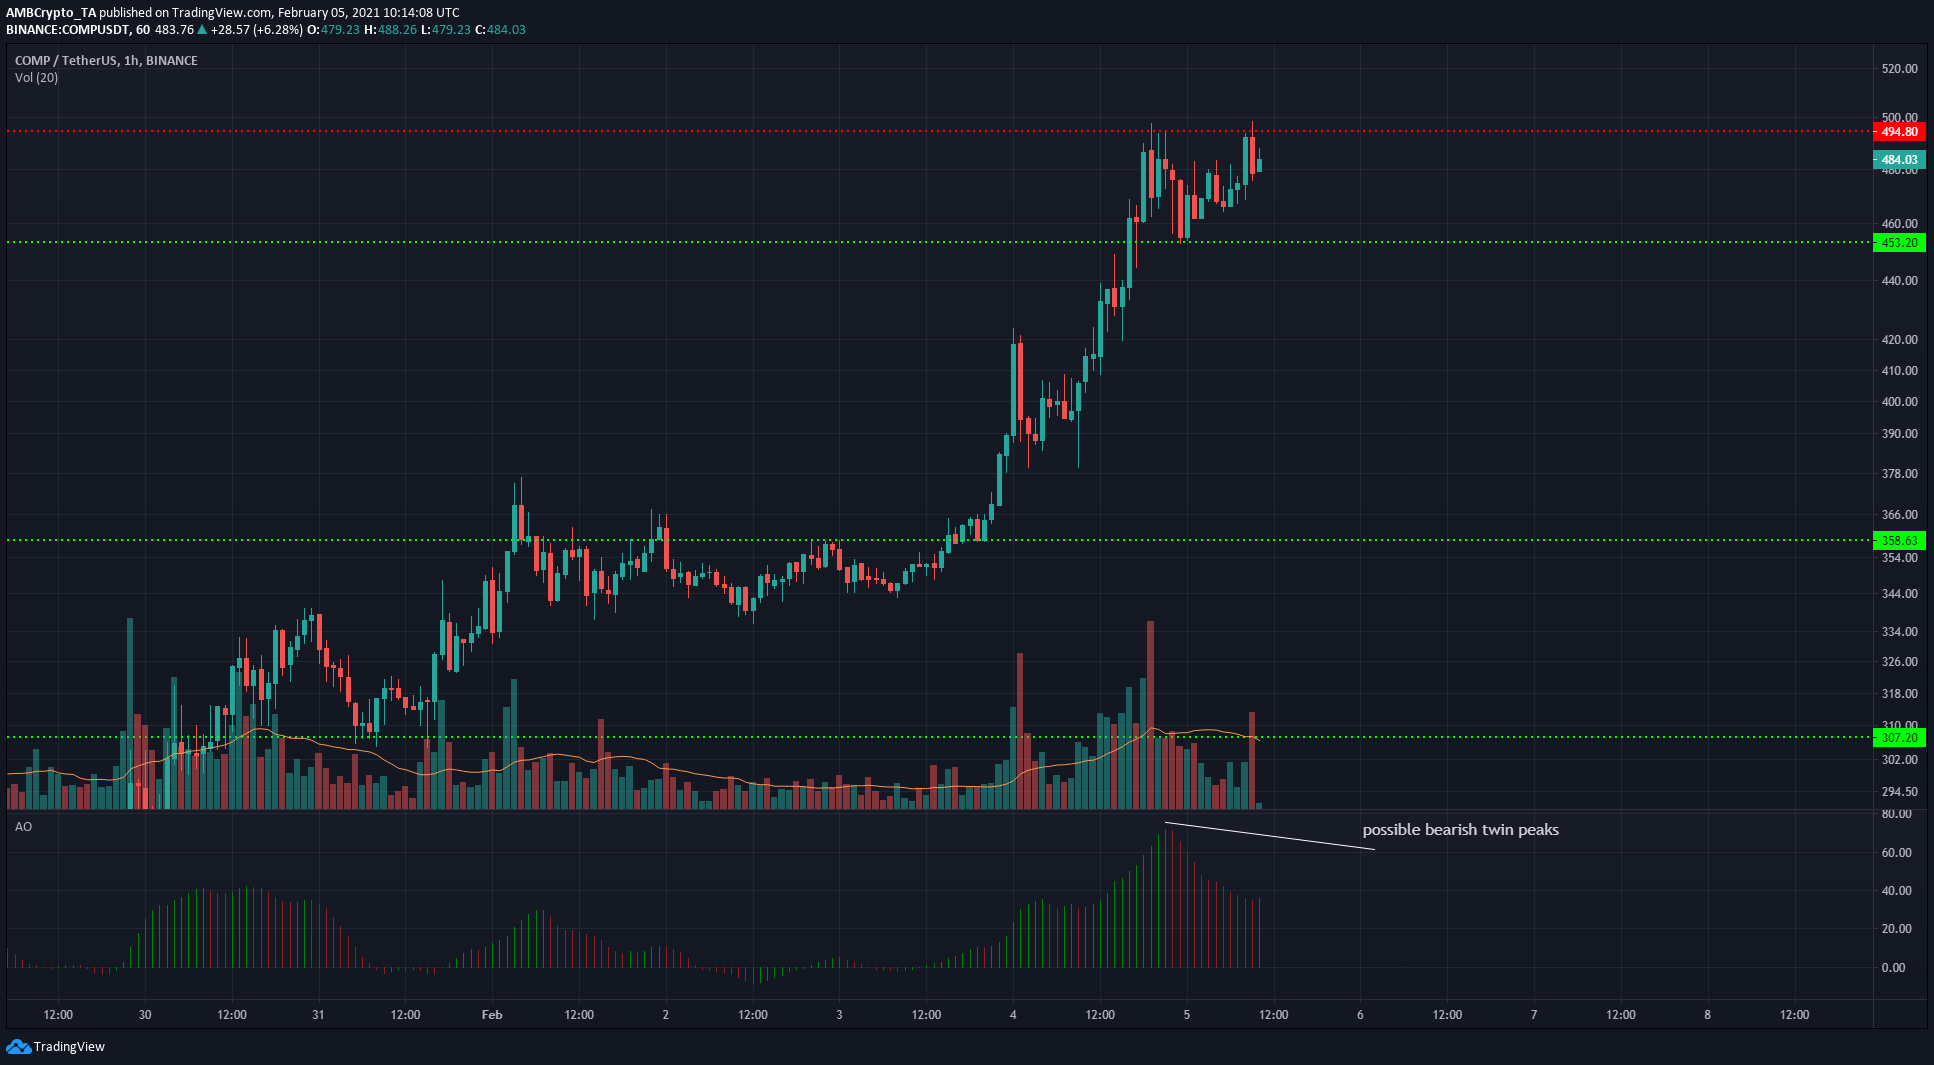
Once more, the 1-hour timeframe was chosen to analyze COMP. The longer timeframes show a strongly bullish digital asset that shows no sign of a retracement yet. However, on the hourly charts, the Awesome Oscillator was bullish but it could form a lower peak than the one registered recently.
This would present a bearish twin peaks setup and would give a sell signal that can be used to scalp a short trade to the $470 region.
There is some resistance from the vicinity of $500, and rejection at this psychological level could see COMP dip to the $450 level of support.
Cosmos [ATOM]
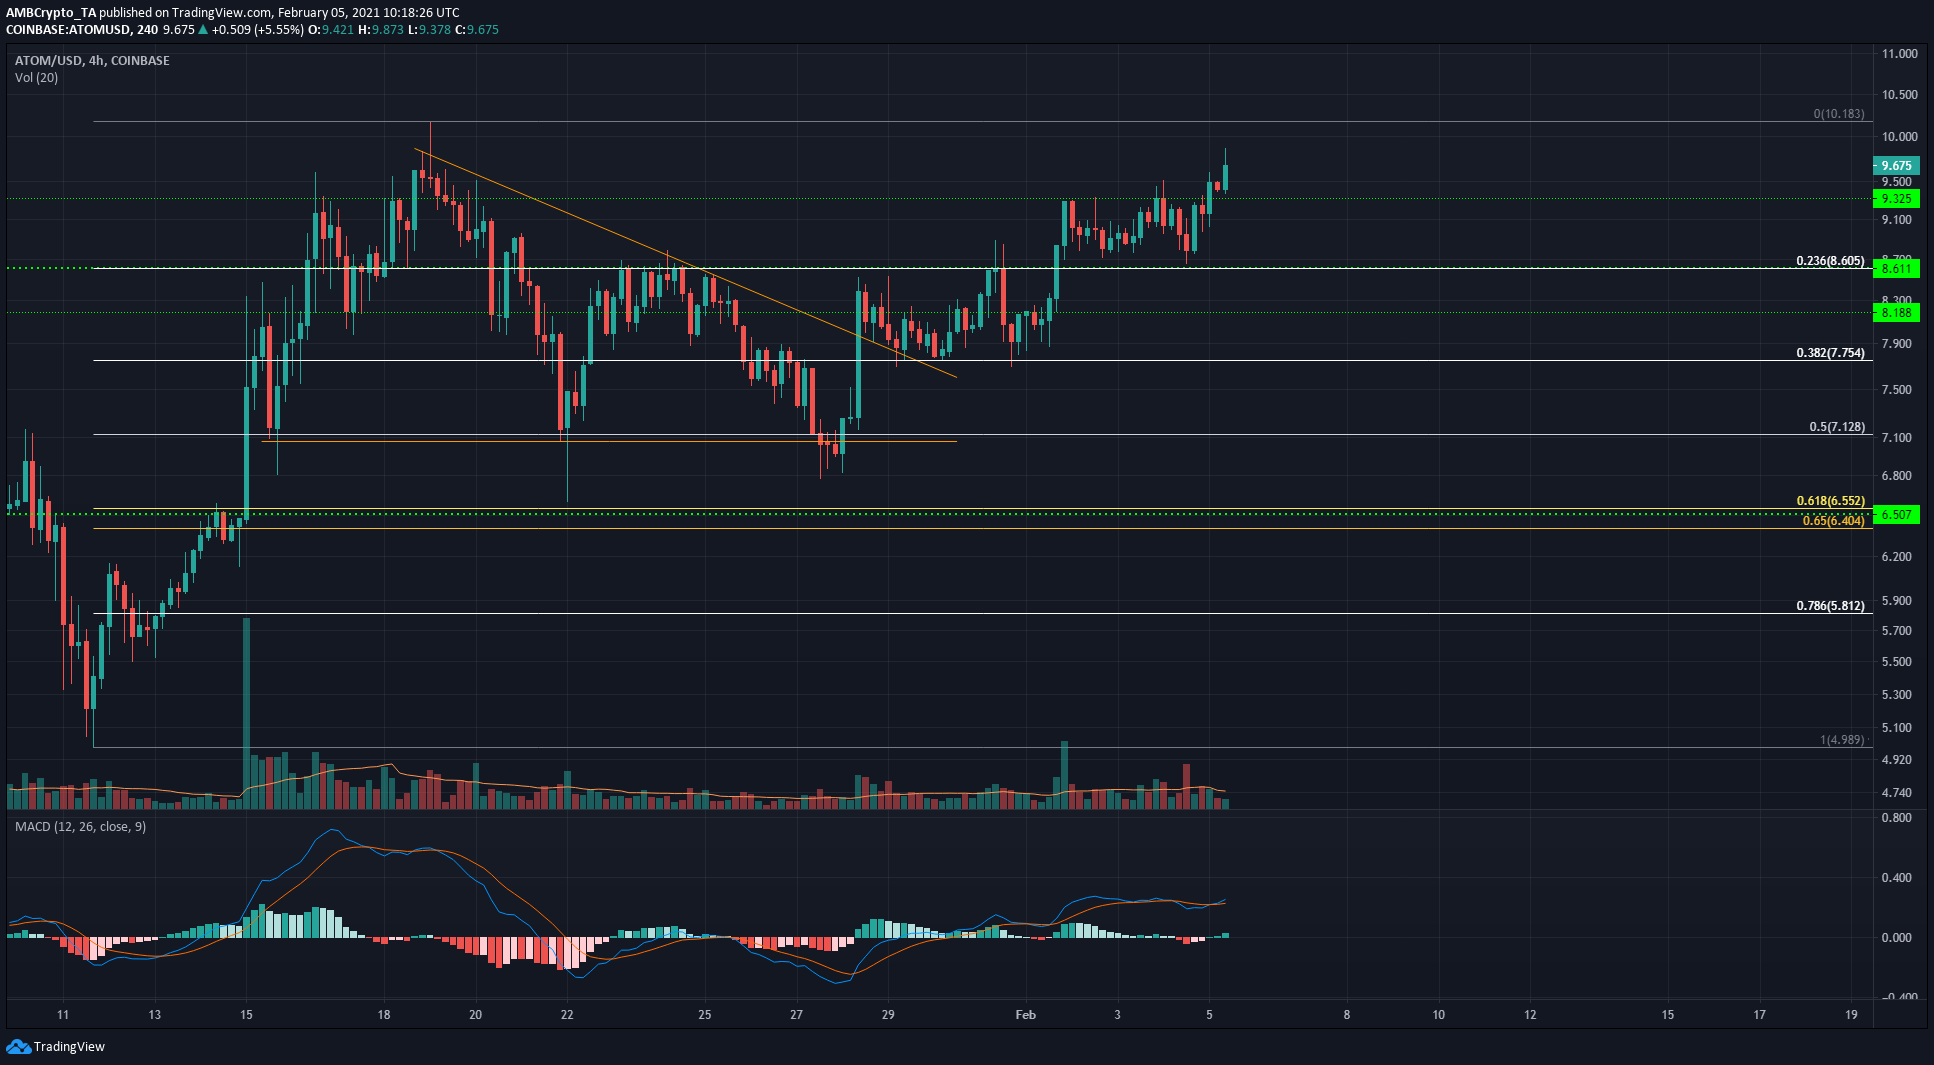
Cosmos broke out of the descending triangle to the upside and reached the projected target of $9.7 that was the peak of the triangle formation. Further on lies the previous local high at $10.2 that saw strong selling pressure to push the price back to $9.4.
The MACD formed a bullish crossover above the zero line, indicating strong bullish momentum for ATOM that could see it break out past $10.2. However, trading volume was yet to gain traction. Levels of support lie at $9.32 and $8.6.


