Litecoin, Crypto.com Coin, Ethereum Classic Price Analysis: 08 March

Litecoin defended the $180-$184 region but faced stern resistance at $194. Crypto.com Coin was in a phase of consolidation, while Ethereum Classic formed a wedge pattern that could see a breakdown to $10.
Litecoin [LTC]
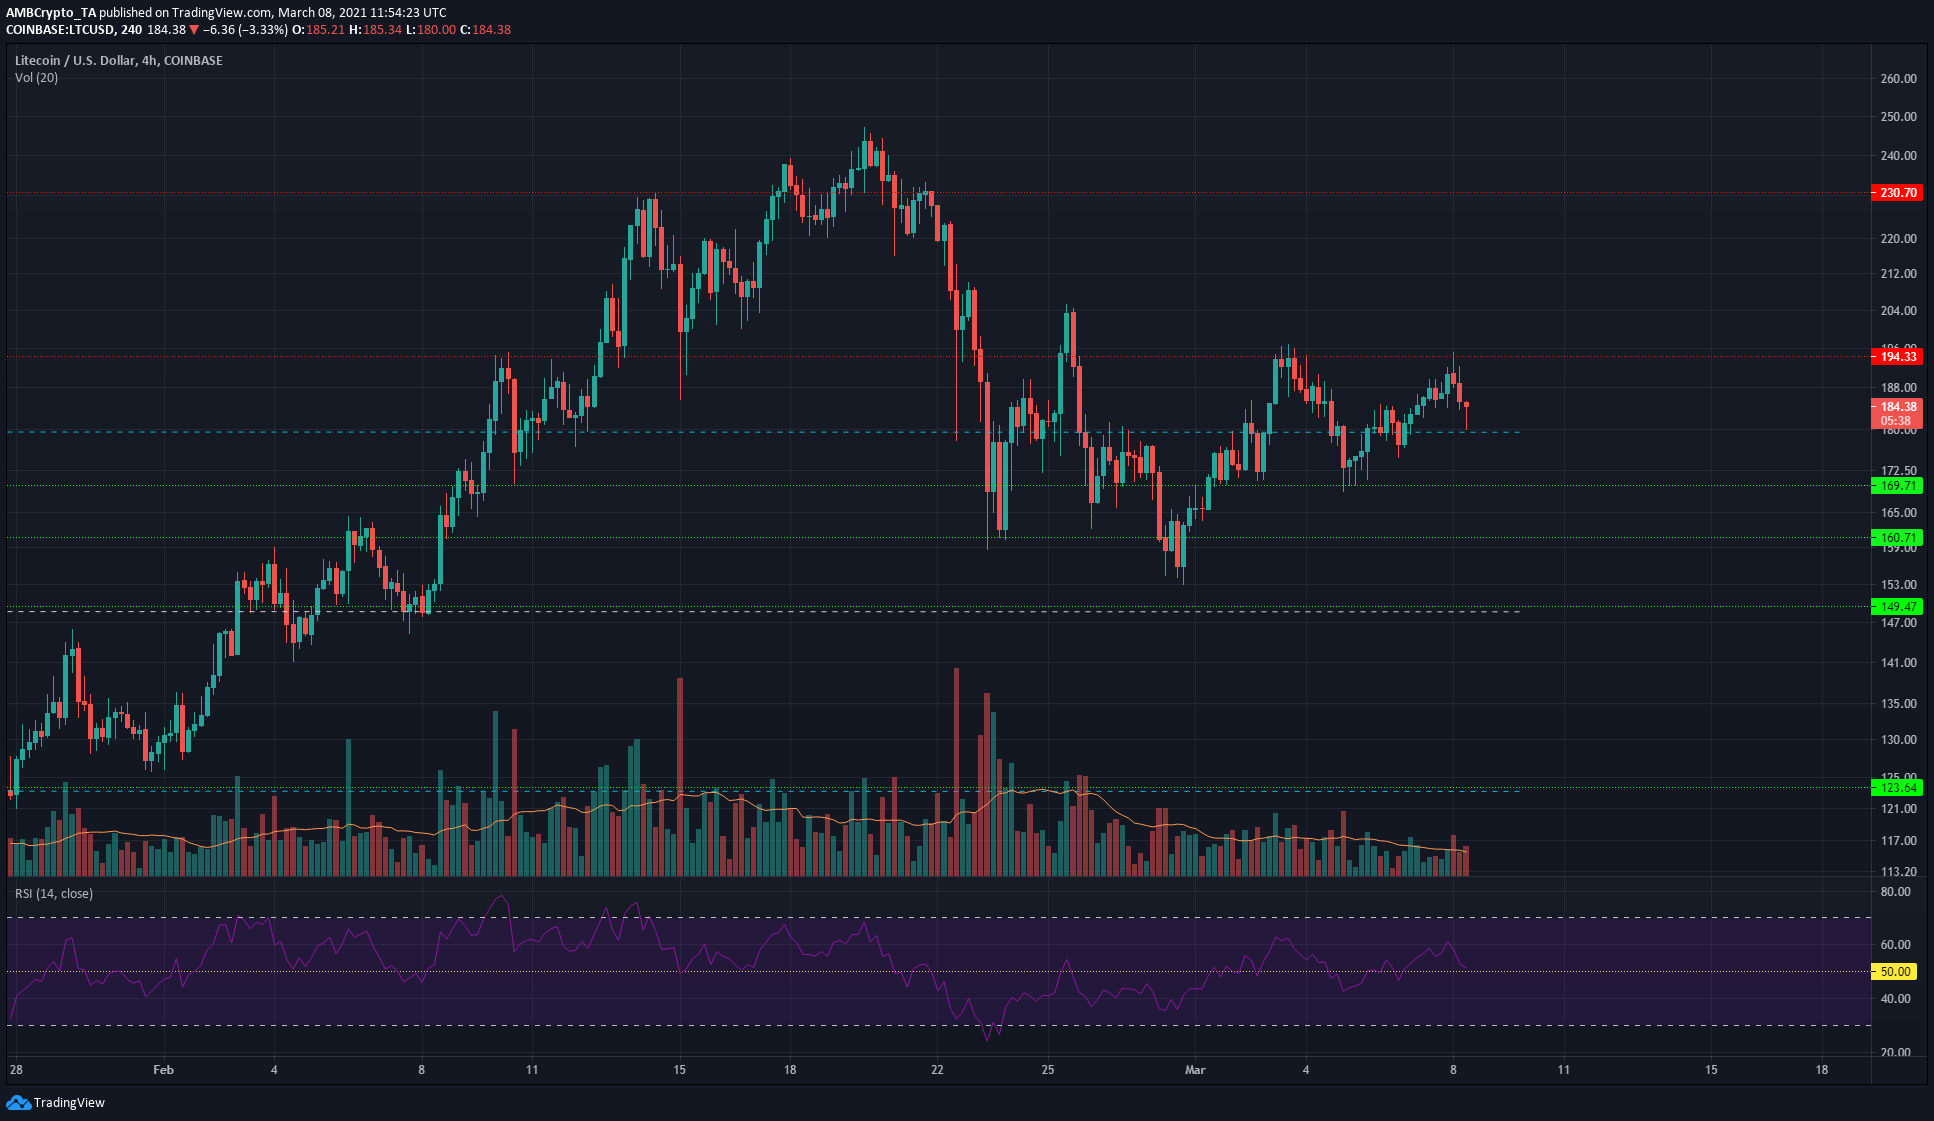
Litecoin was trading between the $194 and $169 levels for the most part of the past week. At the time of writing, the RSI was above neutral 50 and showed bullish momentum behind LTC. The mid-point of this short-term range lies at $184, which has some confluence with the longer timeframe $180 level that has acted as both support and resistance to the price in the past.
On the 4-hour chart, the defense of the $180-$184 region of demand can see LTC climb back to the $194 mark over the next 24 hours. Dipping beneath $180 will likely see LTC move toward $169.
In the long-term outlook, ascending past the $194-$200 area will be the target for bulls. This development will open the way for another move to $230 for LTC.
Crypto.com Coin [CRO]
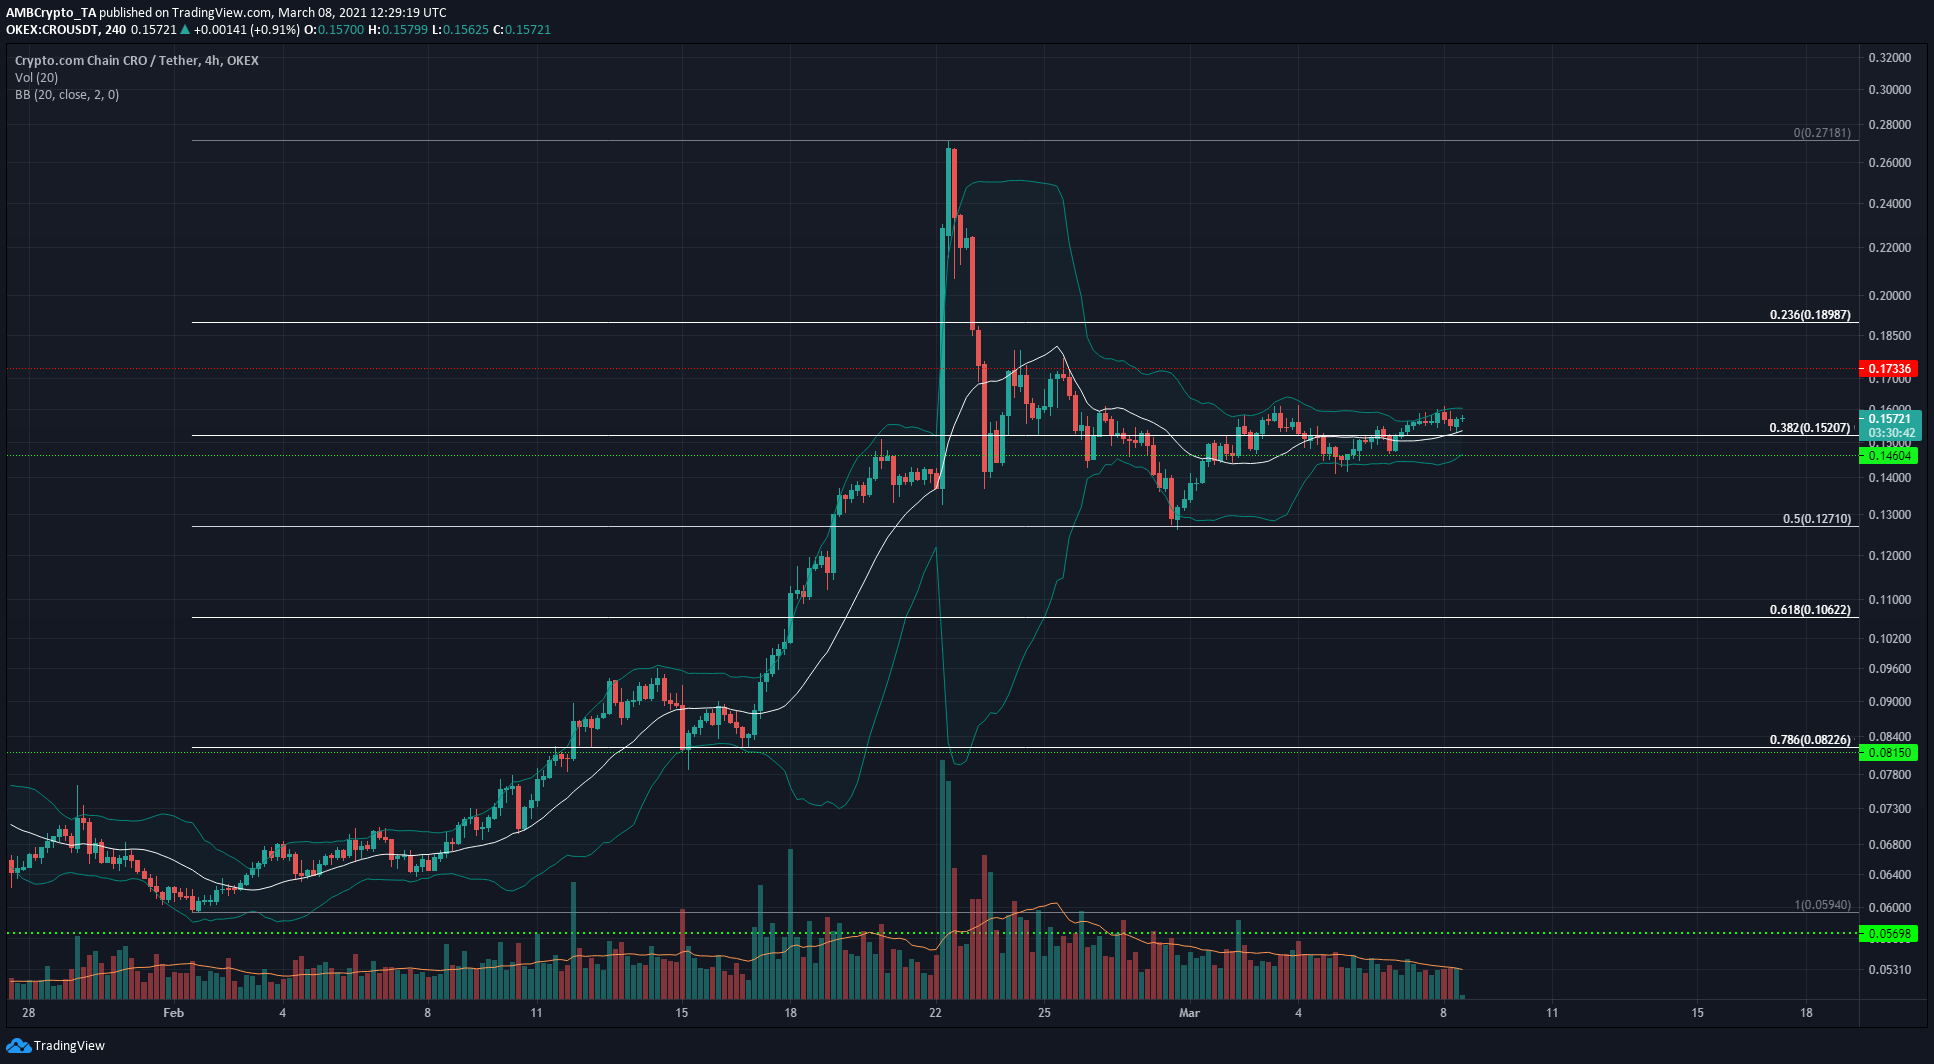
The Bollinger bands were relatively tight around the price of CRO, which was also trading above its 20-period SMA on the 4-hour chart. Climbing past the 38.2% retracement level at $0.152 was also a sign in favor of the bulls.
To reinforce the idea of consolidation for CRO, the trading volume has been steadily decreasing over the past two weeks.
The next levels of resistance for CRO are at $0.173 and $0.189, while a retest of the $0.146-$0.152 area would provide a buying opportunity.
Ethereum Classic [ETC]
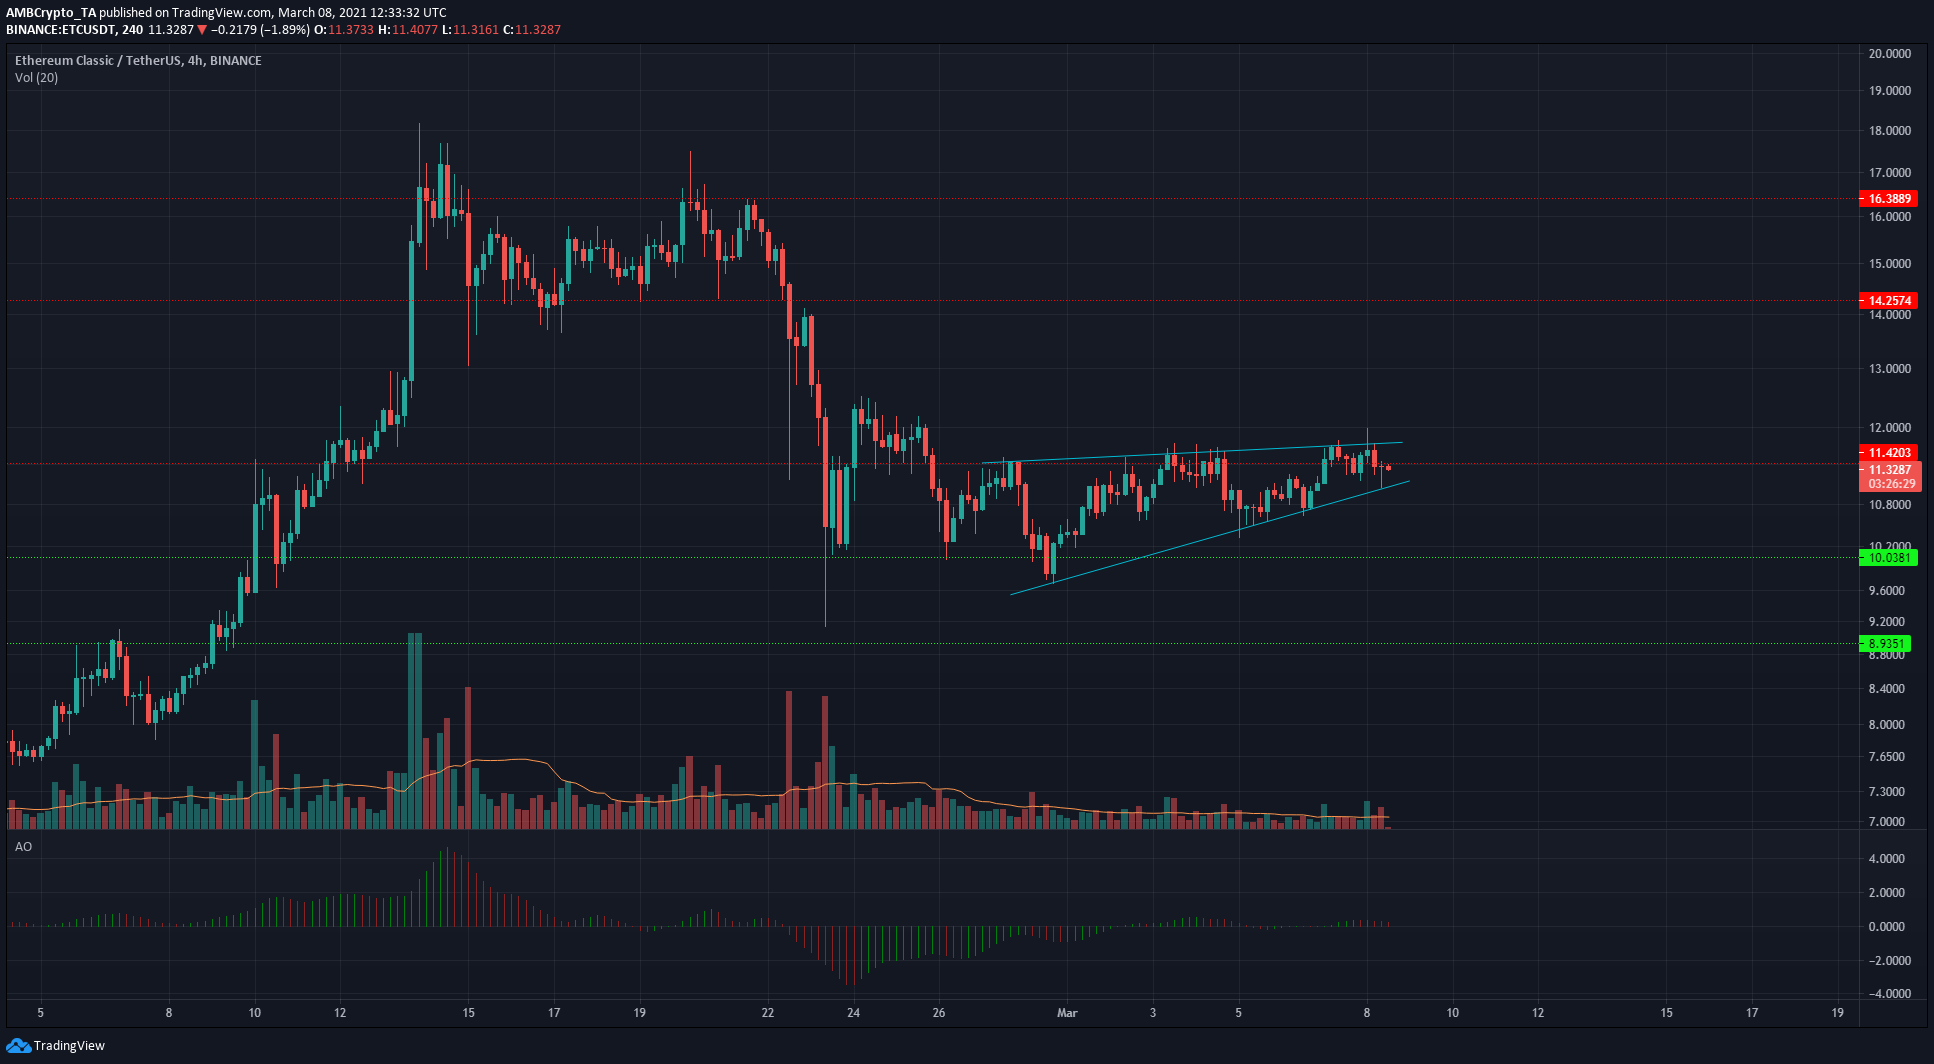
Ethereum Classic formed a rising wedge pattern on the charts. This pattern generally sees a breakdown, and in this context, the bearish target for such a move would be $10.
However, only a trading session close outside the pattern would point toward the direction of the market with more certainty- a breakout upwards is also a possibility.
The Awesome Oscillator showed neutral momentum for ETC over the past week.


