Litecoin outperformed Bitcoin, but not in a way you think

Litecoin [LTC] also referred to as the ‘silver’ to Bitcoin’s ‘gold’, registered a plunge in price over the last week along with several other cryptos.
However, the point that sets Litcoin apart from others is that it also showed better signs of recovery in the last 24-hour period as its performance increased by more than 2%.
The growth registered by LTC in the last 24 hours was even more than top cryptos like Bitcoin and Ethereum. At press time, Litecoin was trading at $54.25.
What metrics suggest
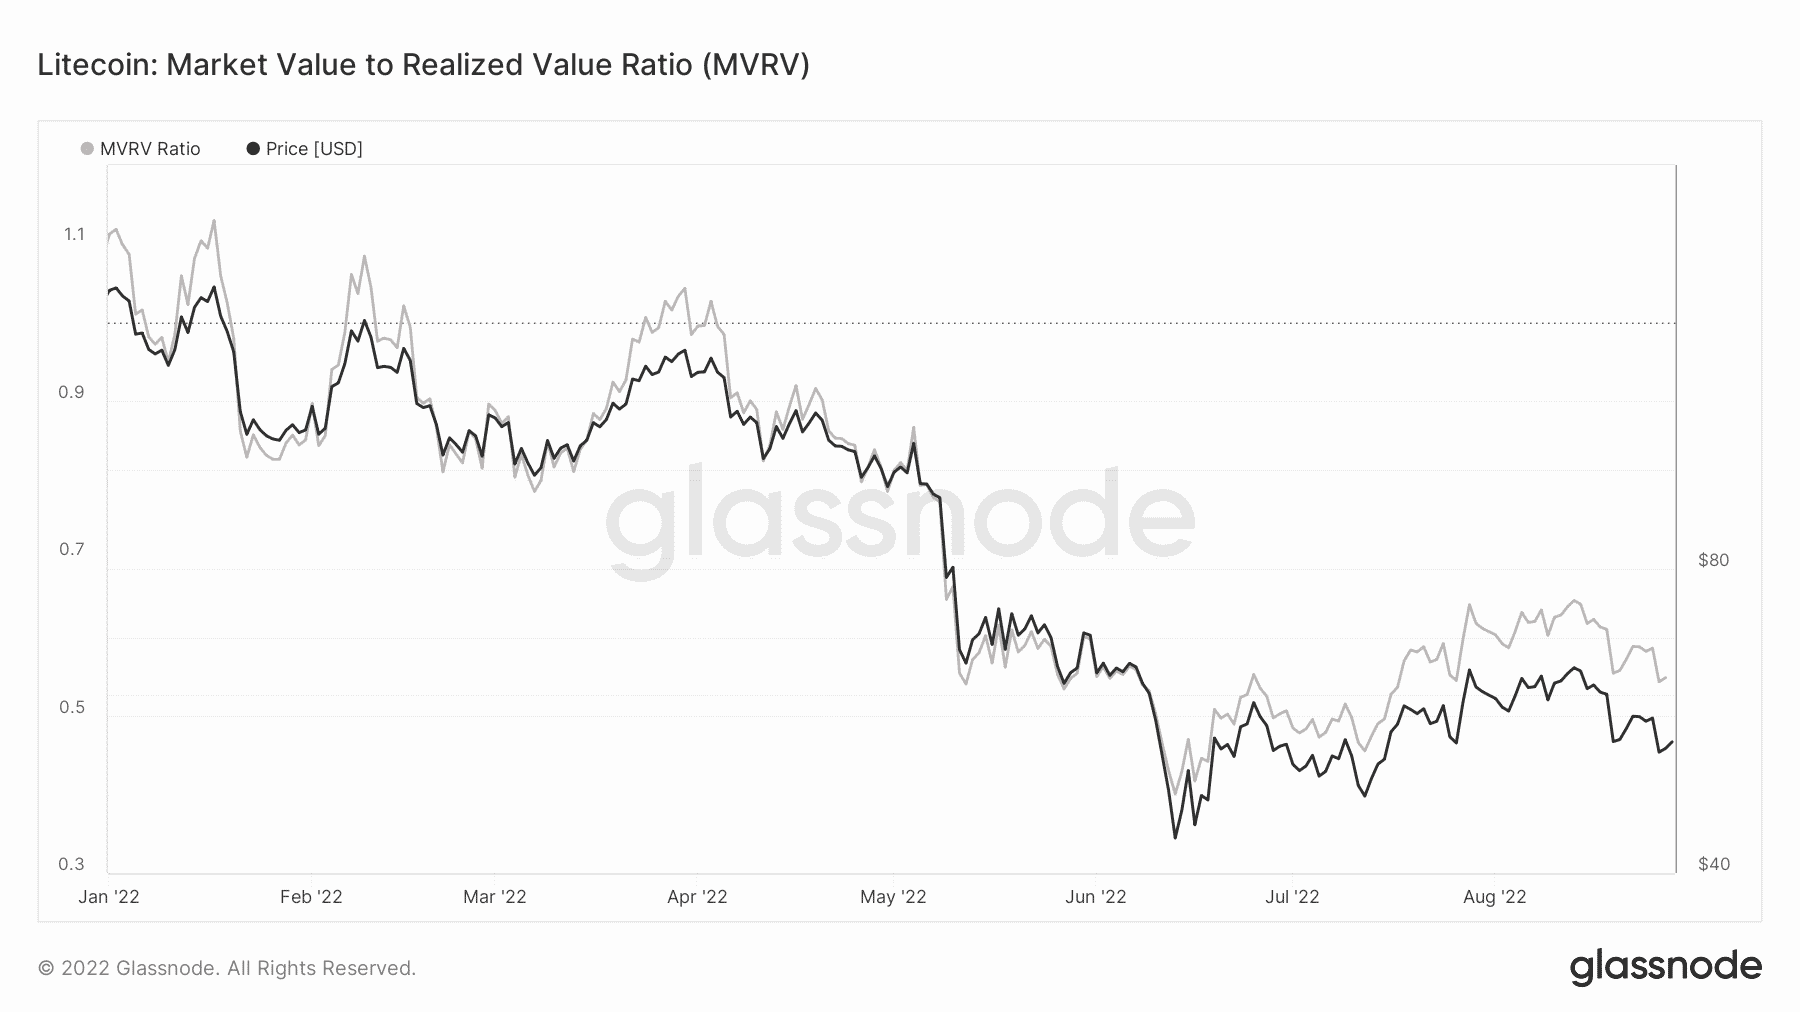
Since the massive market crash earlier this year, most of the cryptos, along with LTC, have struggled to raise their values. However, since July, the market has shown signs of recovery, helping LTC touch the $63 mark in mid-August.
The recent decline pushed LTC’s price to $52. A good sign is that the MVRV ratio also registered a decrease along with LTC’s price, indicating a possible market bottom. Therefore, a possibility arises of Litecoin continuing to move upward in the coming days.
Litecoin holders can take it as a signal of taking a gradual long position.
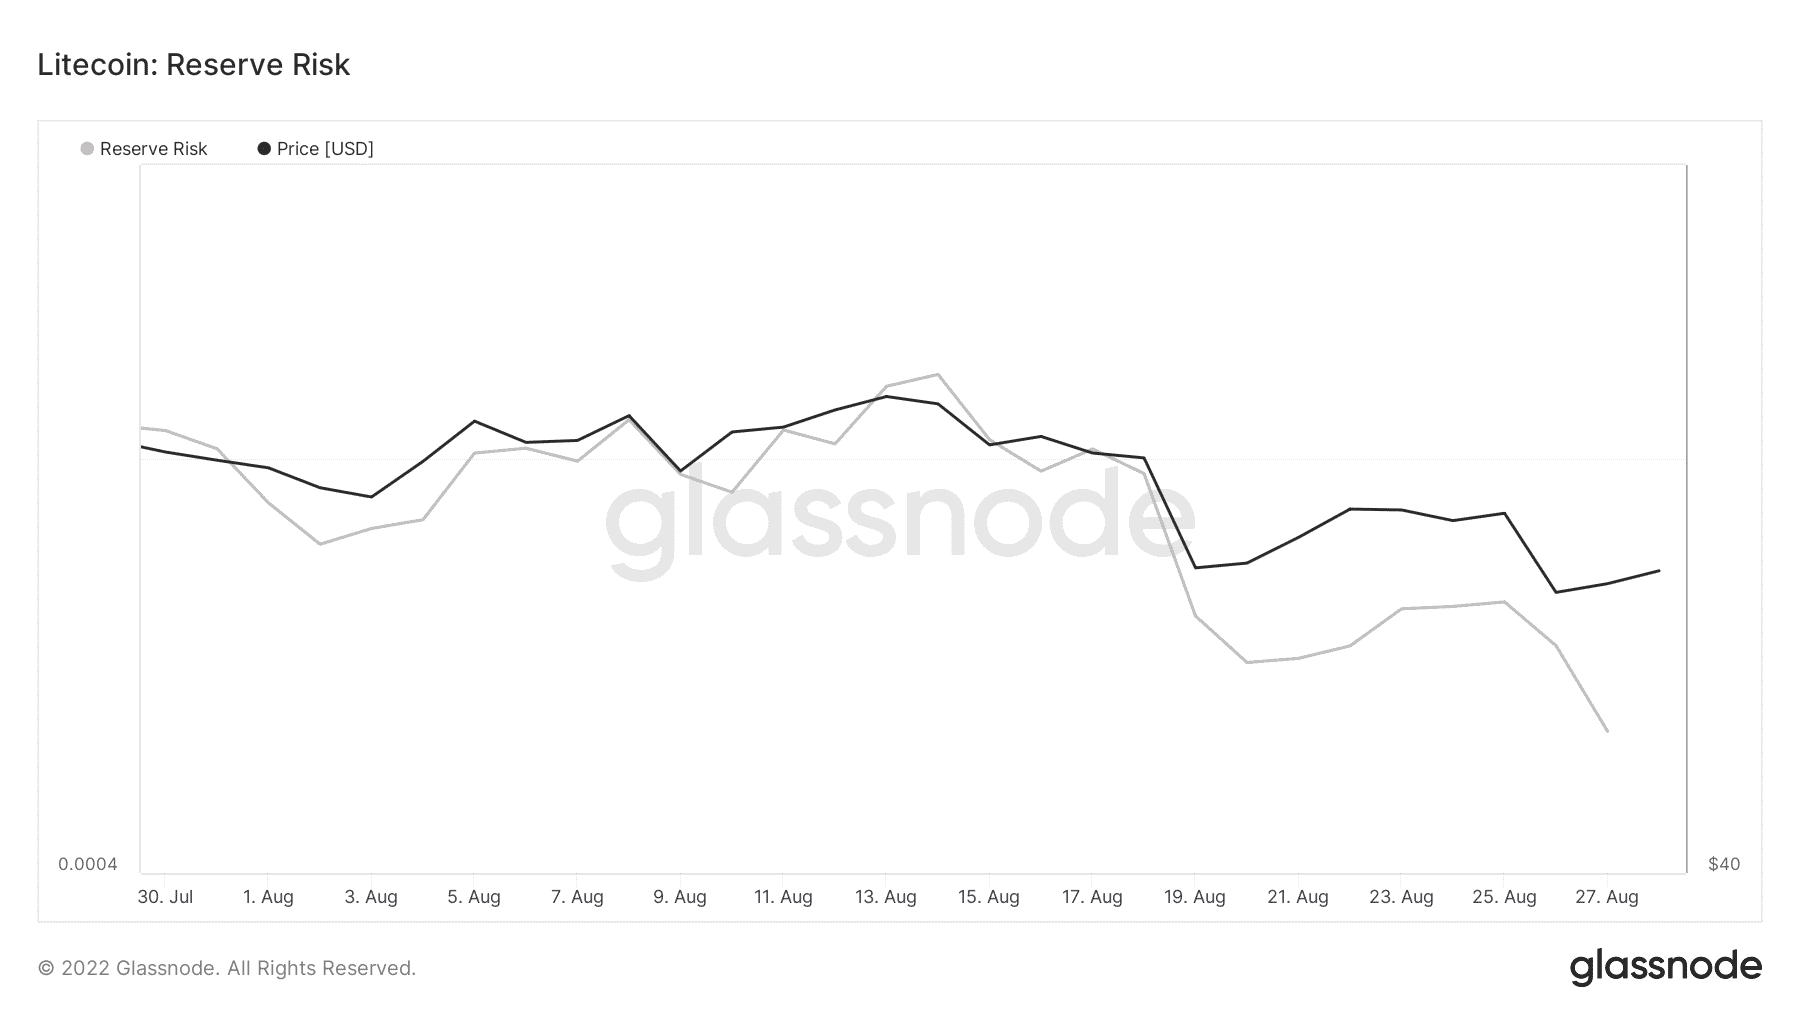
Moreover, an interesting development for investors was that the reserve risk of LTC also moved downward, which created an opportunity for investors to buy as the risk-to-reward ratio improved.
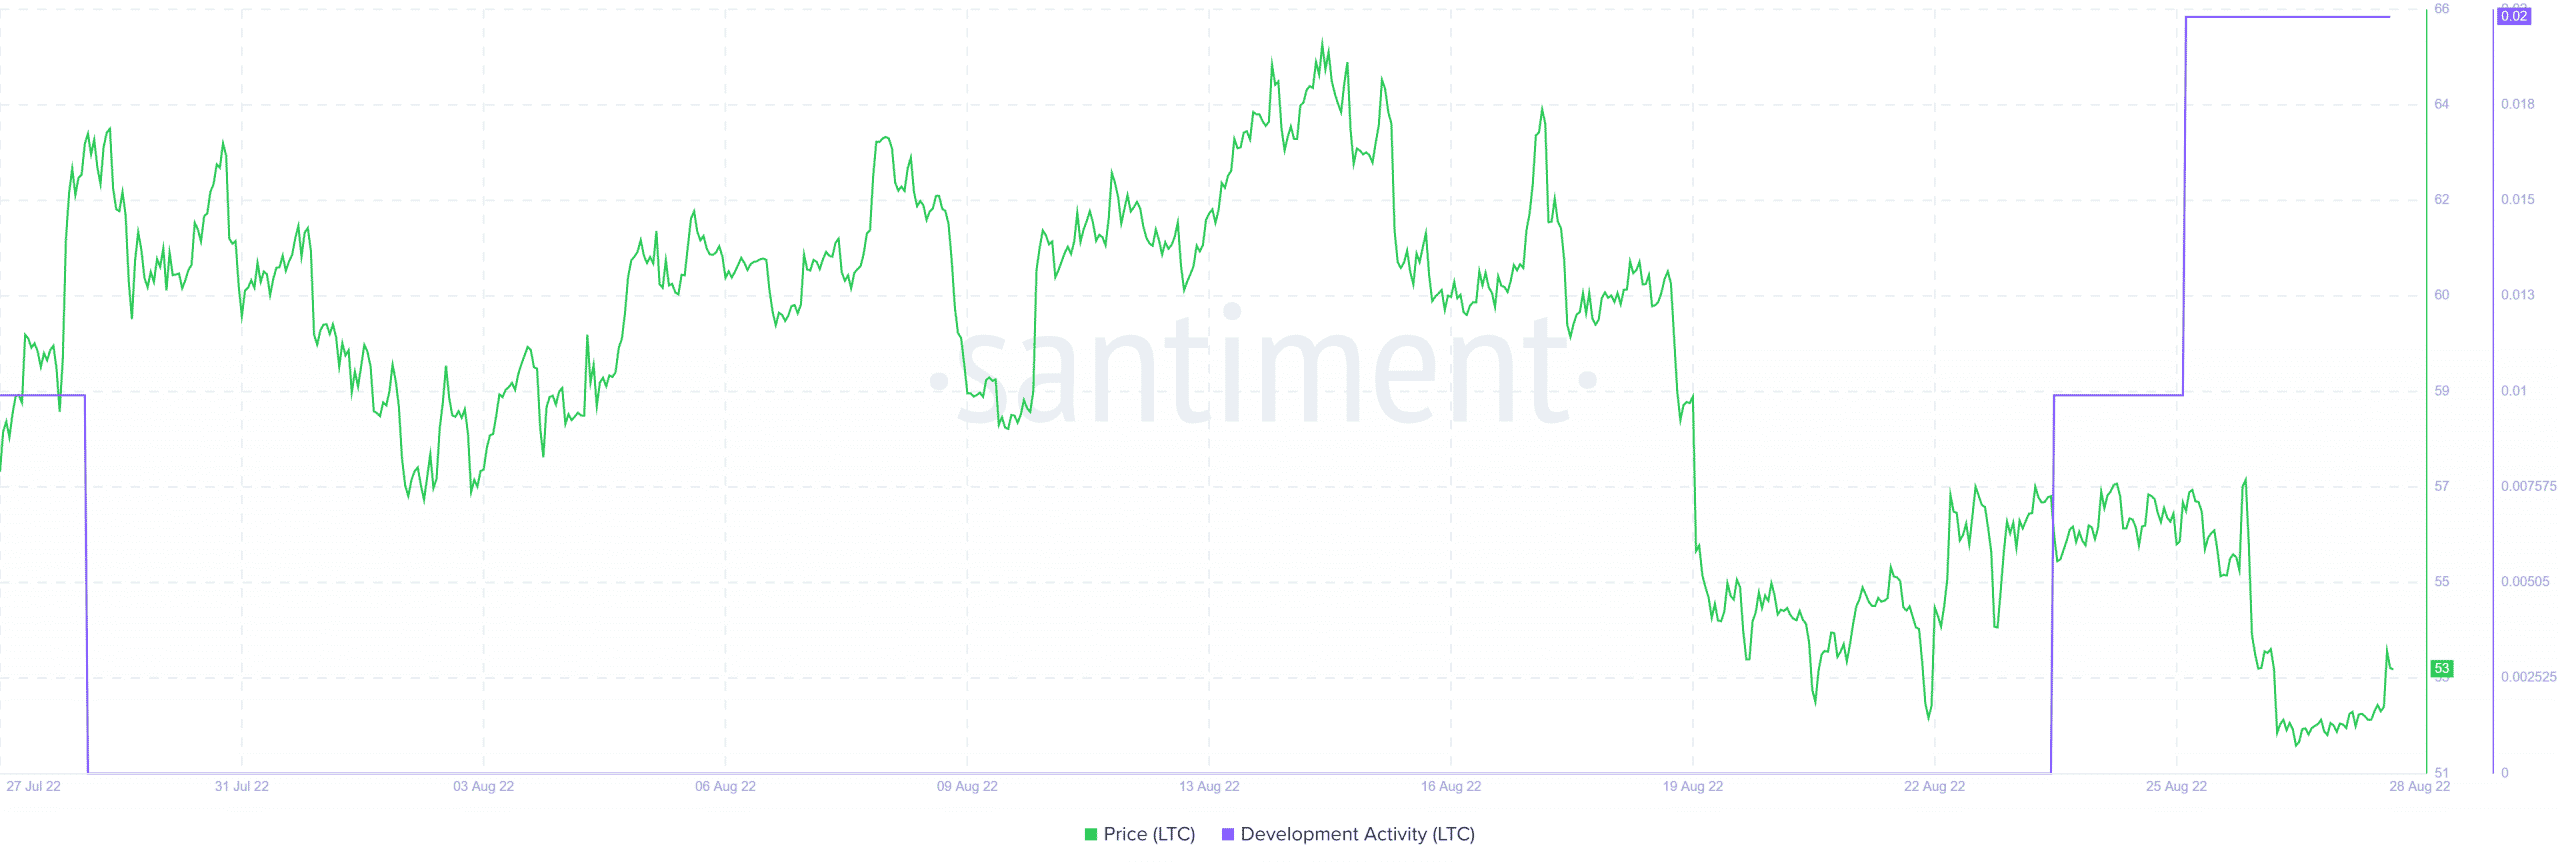
While the aforementioned metrics registered a decline, Litecoin’s development activity surged during the last week. This, by and large, is a positive signal for crypto as it represents the interest and effort of developers in improving the blockchain.
Going ahead
Interestingly, the readings from LTC’s 4-hour chart were ambiguous. While some indicators gave hope for brighter days ahead, some suggested otherwise.
The MACD displayed a bullish crossover on 28 August as the blue line was on the verge of flipping the red. This indicated that a further surge in LTC’s price can be expected. However, RSI was seen resting at the 44.55 mark without showing any explicit bullish sign like MACD.
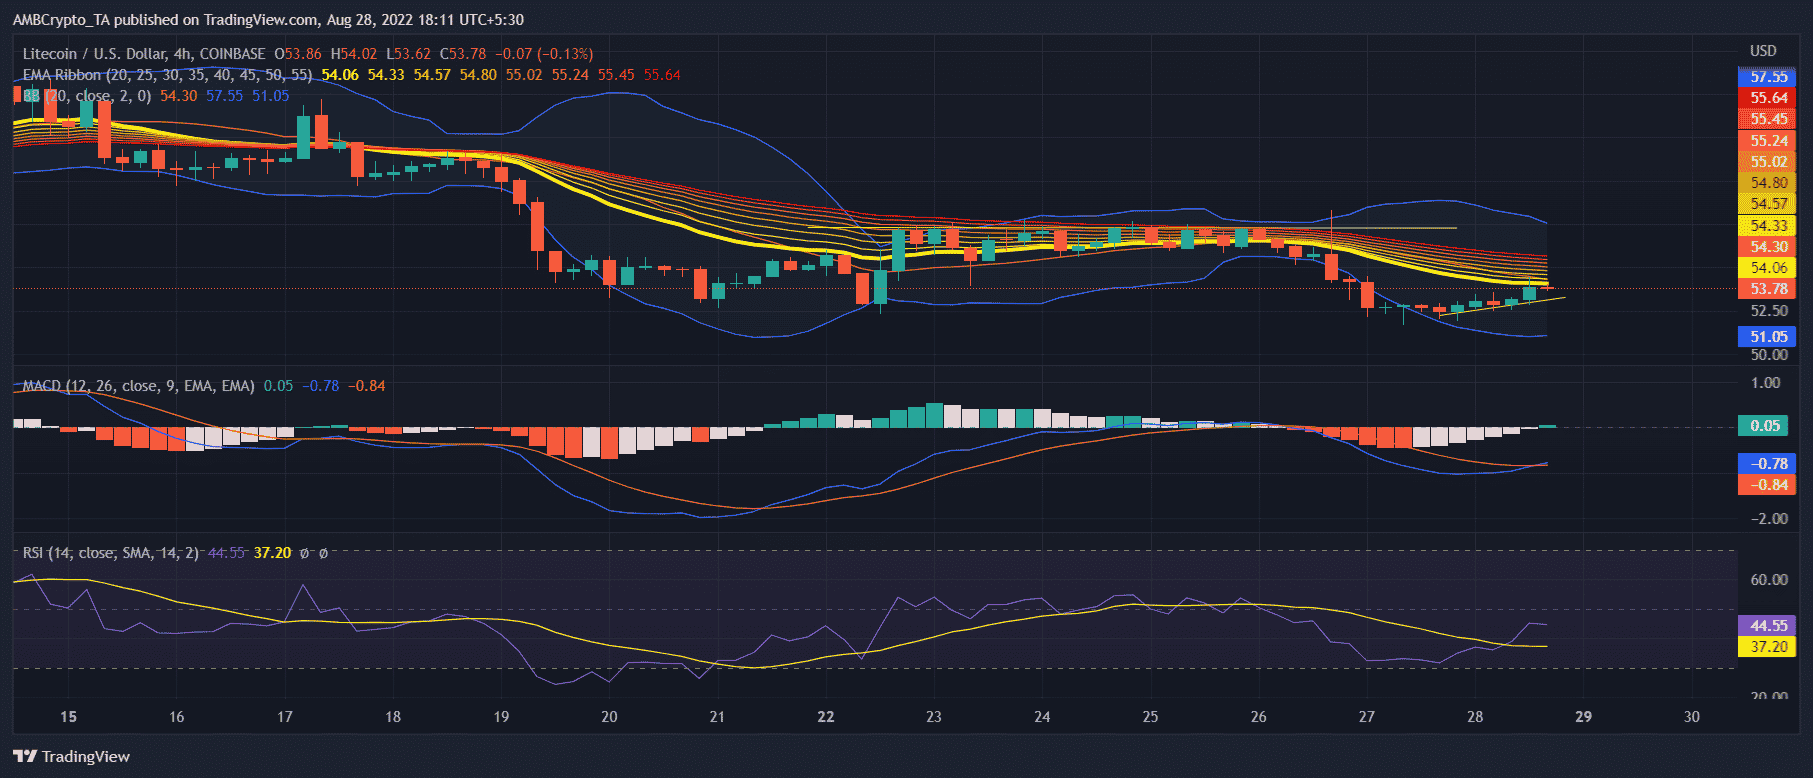
On the other hand, the Exponential Moving Average (EMA) ribbon hinted at a bearish edge in the market as the red line was well above the yellow line, and the gap seemed to be widening.
Moreover, Bollinger Bands also suggested a possible squeeze in LTC’s price over the next few days. Thus, minimizing the possibility of a northward breakout.