Litecoin Price Analysis: 15 April

Disclaimer: The findings of the following analysis are the sole opinions of the writer and should not be taken as investment advice
Litecoin’s price has seen tremendous bullish momentum over the past week. The uptrend the coin is on currently began in the last week of March, with the same propelling the alt’s price on the charts. In fact, this resulted in Litecoin registering gains of over 55 percent in just two weeks.
At the time of writing, LTC was trading at $274.4, with the crypto noting a market capitalization of over $18.5 billion. With a price hike of over 26 percent over the past 7 days, LTC’s northbound momentum seemed formidable and it may help propel it closer to the $320-price level in the coming week.
Litecoin 1-day chart
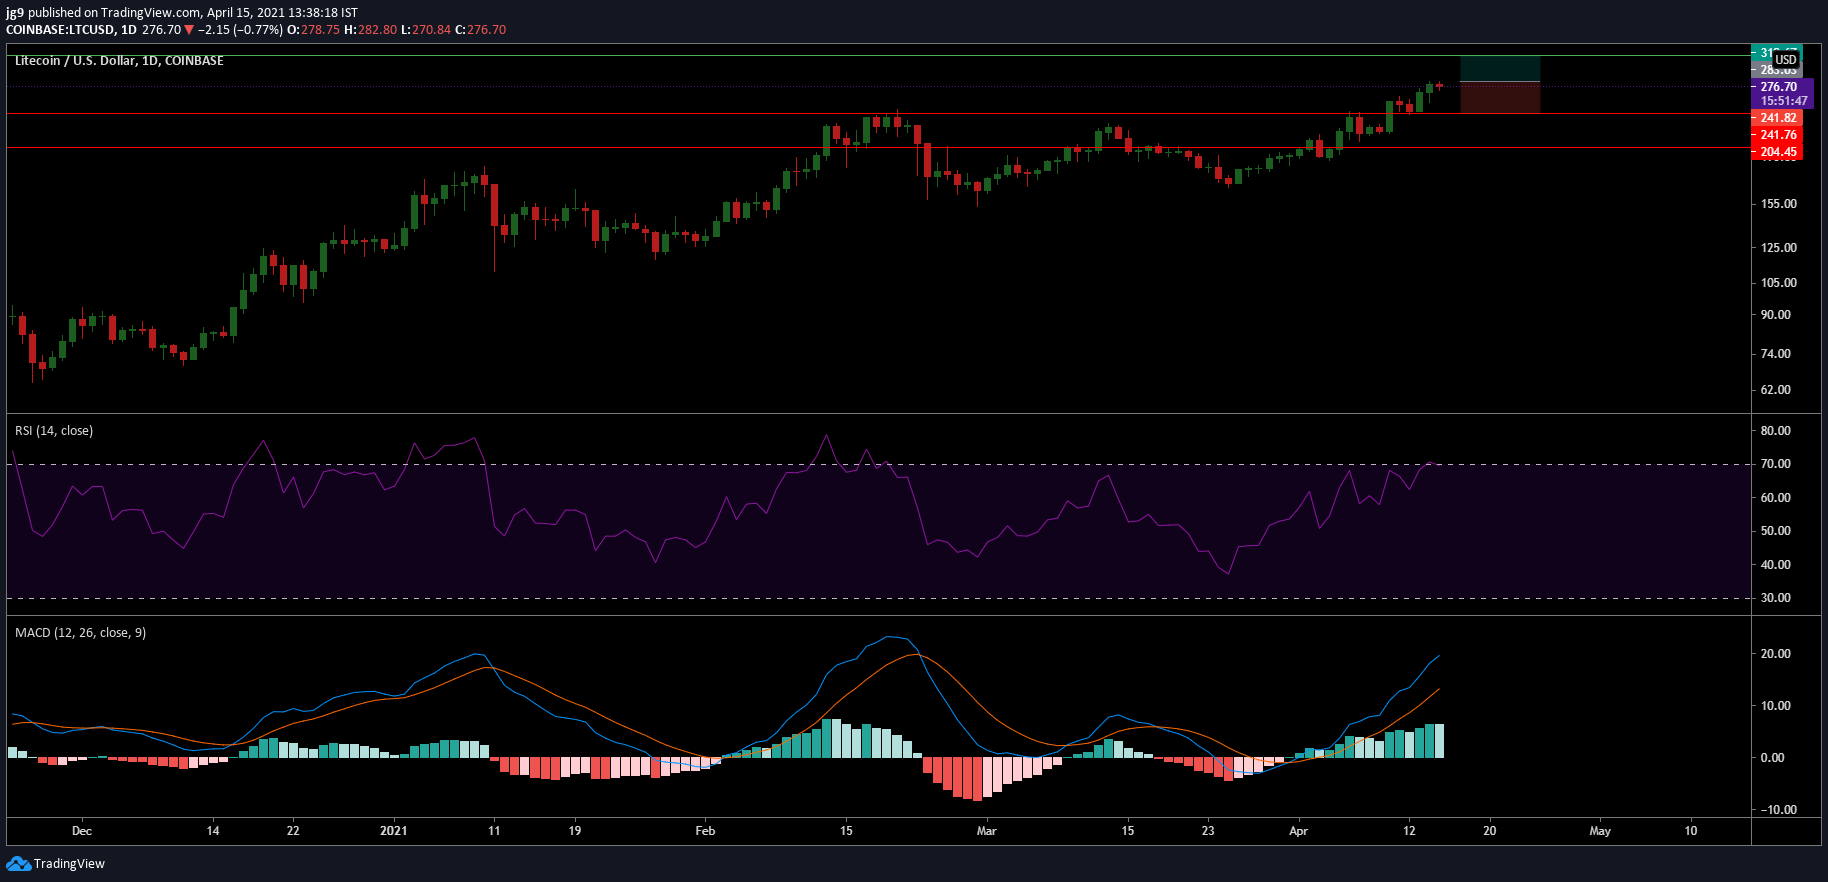
Litecoin’s price has been able to sustain a very clear uptrend that began on 25 March. Since then, the altcoin’s price has been able to move upwards and maintain its position without becoming subject to a price correction. Interestingly, Litecoin still has enough momentum to continue on its upward run as it heads closer to its next level of support.
In such a scenario, LTC’s traders can benefit from long positions and take profit around its next resistance level at $321. However, given the current market, this is likely to play out in the coming days and after that, Litecoin may see a minor correction. Hence, it is unlikely that the $321-price range will be breached and LTC will see further price discovery.
However, unless there is a drastic change in the crypto-market, it is quite likely that the coin may move towards the $321-range in the coming days. In case of a correction, LTC can count on two strong support levels at $241 and $204.
Rationale
The MACD indicator underwent a bullish crossover, thanks to which, it doesn’t look like a trend reversal is likely to take place in the coming days. The RSI indicator also echoed a very bullish outlook. However, the RSI found itself in the overbought zone at press time, with the indicator trying to make its way out of it.
Hence, in the next 3-4 days, LTC may see a significant dip in bullish momentum and may not be able to go past $321 again.
Important levels to watch out for
Entry: $283
Stop loss: $241
Take profit: $319
Risk/Reward Ratio: 0.89
Conclusion
At the time of writing, Litecoin had adequate bullish momentum to continue on its uptrend. In the next few days, this is going to enable LTC to move towards its immediate resistance level at $321, giving long traders an opportunity to take profit. However, there is also the possibility that in the coming days the coin may see its bullish momentum decrease and hence, may not be able to breach the $321-mark following a small price correction.