Litecoin sees strong selling pressure but defends $50, what next for LTC

Disclaimer: The findings of the following analysis are the sole opinions of the writer and should not be considered investment advice.
- The higher timeframe structure remains bearish for Litecoin
- Reaction at the $52 zone could reveal the path forward
Litecoin [LTC] has faced resistance at the $55 mark since mid-September when the price crashed from $58 to $50. In October, LTC faced rejection at this resistance yet again. The downtrend of the past two weeks was pronounced on the lower timeframes.
Here’s AMBCrypto’s Price Prediction for Litecoin [LTC] in 2022
A recent article on the price action of Litecoin highlighted how the higher timeframe bias was bearish. The multi-month range’s mid-point lay at $54, and the lows at $43.3. Can the bears force Litecoin beneath $50 once more, and eventually as far south as $44?
Bearish order block at $52.5 but $50 was reclaimed by the buyers
Examination of the higher timeframe charts such as 12-hour and one-day showed the market structure was bearish. Therefore, on lower timeframes, traders looking to trade with the trend can look for shorting opportunities.
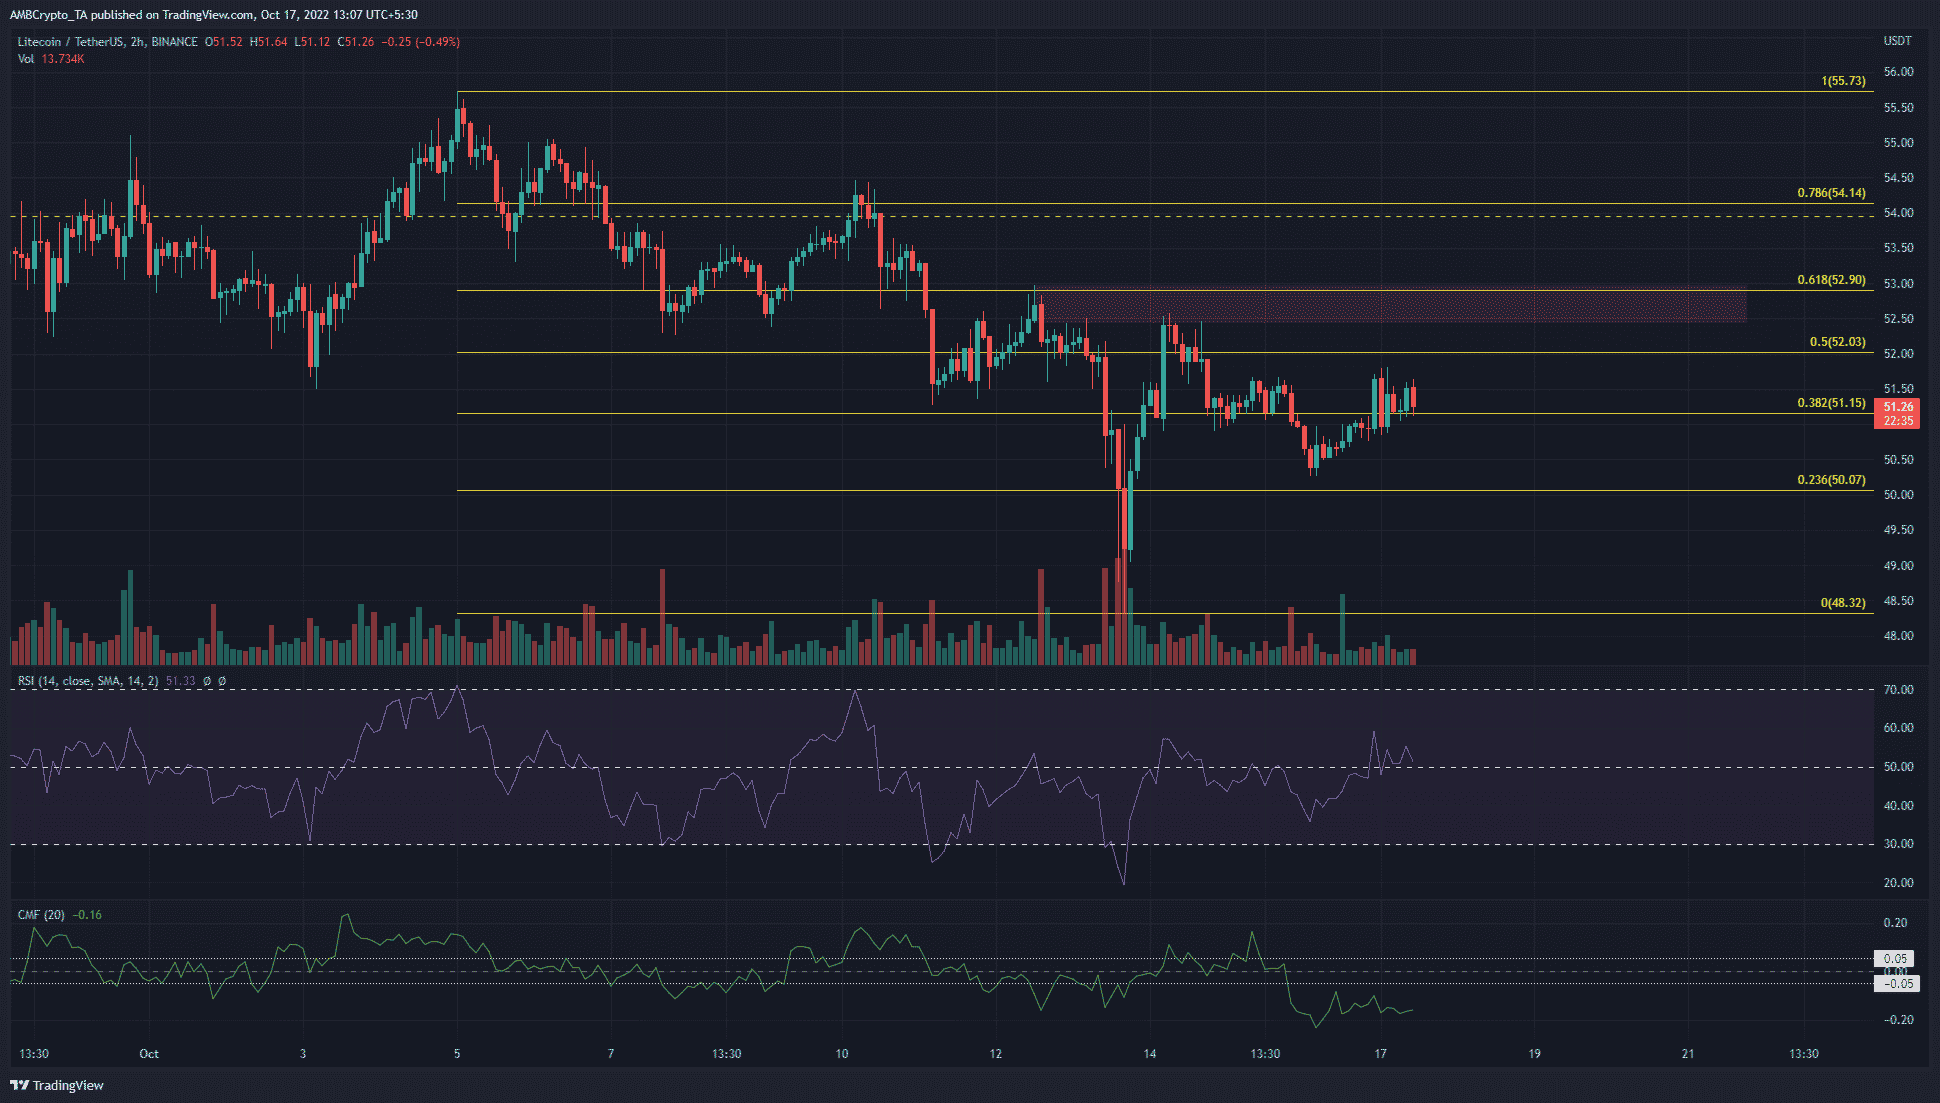
A set of Fibonacci retracement levels (yellow) were plotted based on LTC’s move down from $55.73 to $48.32. It showed the 61.8% and 78.6% retracement levels to lie at $52.9 and $54.14 respectively.
In the past week, a bearish order block formed at $52.5. The short-term move up was rebuffed at $52.9 and a break in market structure to the downside occurred, marking it as a bearish order block. Therefore, Litecoin can be expected to face a rejection near the $53 mark due to confluence of the order block and the 61.8% level.
The indicators on the two-hour chart showed some bearishness as well. The Relative Strength Index (RSI) climbed back above neutral 50, but did not signal an uptrend in progress. The RSI was unable to push past the 60 mark. Meanwhile, the Chaikin Money Flow (CMF) was moving well below the -0.05 mark. This denoted significant cash flow out of the market, and heavy selling pressure.
Funding rates showed futures traders flipped bullish over the weekend
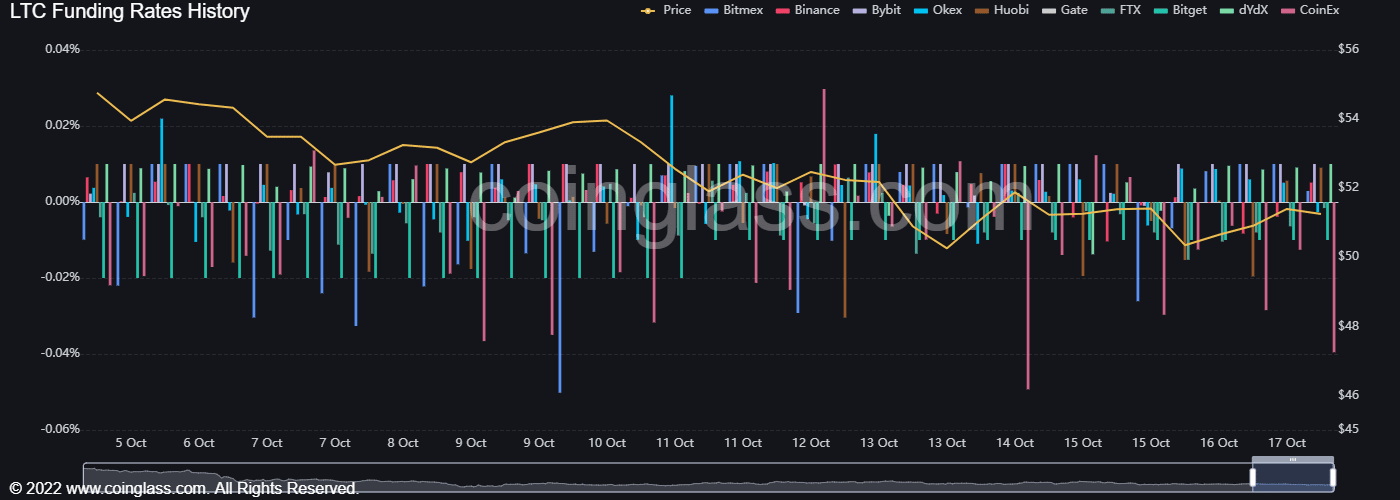
The funding rates across major exchanges showed the funding rate on Binance went from negative in recent days to slightly positive. The same was true on Huobi. This suggested that speculators in the futures market had been bearish but flipped their stance recently.
The Long/Short Ratio on Coinglass showed that Litecoin bears had a slight advantage in the past 24 hours. Alongside the fact that Litecoin appeared to have flipped the $50 zone back to support, there was a possibility of the short-term bounce continuing. The bearish order block at $52.5 will likely resist the bullish advance. A move below $50 could see LTC descend toward $44.