Litecoin: These signals lend more credence to a bearish trend as opposed to a rally
September has been full of mini-crashes in the cryptocurrency market. While some alts have overcome several waves of selling pressure, others have struggled to regain lost ground. Litecoin was somewhere in between. The alt trimmed its losses at a support line of $145, recovered by 14% but was still below levels of bullish control.
To assert its dominance, LTC needed to close above certain key levels. However, the market aligned more favorably for sellers, who were ready to ramp up the pressure. At the time of writing, LTC traded at $151.4, up by 4% over the last 24 hours.
LTC Daily Chart
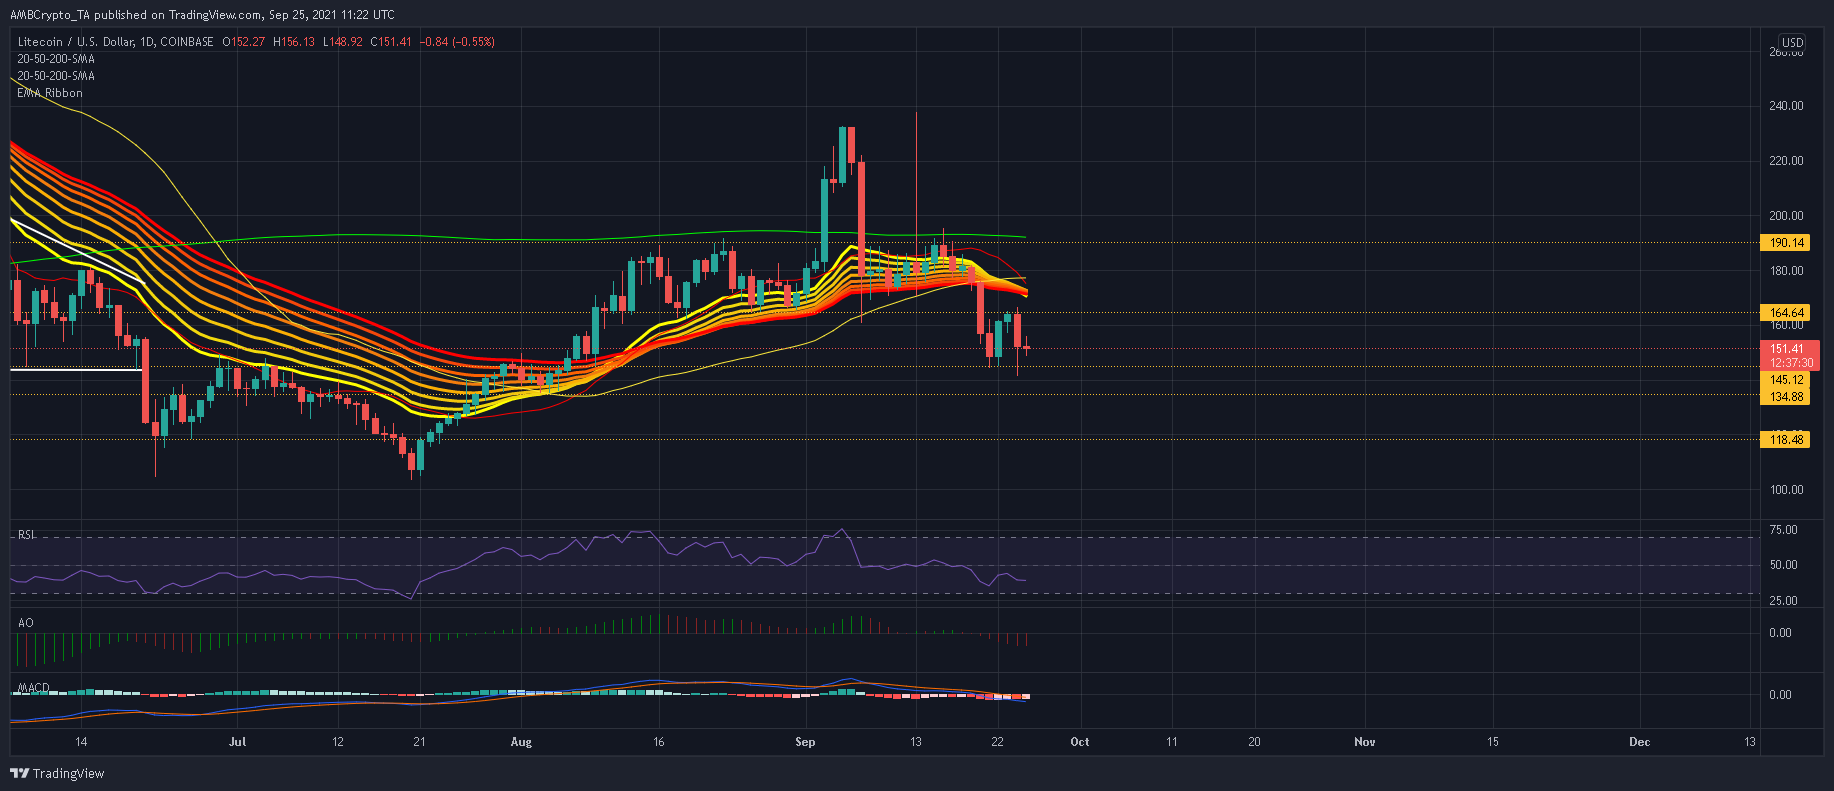
LTC’s support around $145 has been key ever since the 19 May crash. This defensive area prevented multiple breakdown attempts in early-June and transitioned to a daunting resistance during July. The region was once again under the spotlight after LTC declined by 24% over the past week. This was certainly a positive sign as a strong support mark quelled yet another round of selling pressure.
However, LTC needed to claw back some important levels to attract more buyers to the market. The most immediate barrier lay at $165, from where the confluence of the 50 and 20 SMA’s would be targeted. The final resistance lay at the 200-SMA (green) around the $190-mark. A successful close above the aforementioned areas would put buyers back in the driving seat, which would allow for a push above $233.
However, this structure would be lost in case LTC closes below $145 on strong volumes. The price could drop as low as $103.7 if selling pressure overwhelms the buyers. Moreover, the indicators backed an unfavorable prediction after slipping below crucial areas.
Reasoning
For the moment, LTC indicators aligned more favorably for sellers than buyers. The MACD and Awesome Oscillator weakened below their half-lines and exposed the market to short-selling. Moreover, the candles were now below their EMA Ribbons- a reading which normally marks the beginning of a bearish trend. If buyers fail to adapt immediately, LTC was greatly exposed to another sell-off.
Conclusion
Considering LTC’s indicators, its support of $145 would be under immense pressure once again. A close below this defense would open the doors to July lows of $134.8, $118.5 and even $103.7. For a bullish outcome, LTC would need to topple $165. This would carve a path towards $233.


