Litecoin traders going short must consider LTC’s inability to break past this level

Disclaimer: The findings of the following analysis are the sole opinions of the writer and should not be considered investment advice.
Litecoin [LTC] has not seen a large amount of volatility in recent weeks, relative to the rest of the altcoin market. The past month saw LTC range between $52 and $64, a modest 22% price difference measured from the bottom.
In the meantime, Bitcoin [BTC] slipped below the $20.8k support after a firm rejection at $24k in mid-August. The USDT Dominance metric has also risen in the past month to indicate investors moving to holding Tether and fleeing the crypto market.
Fear could further rise in the weeks to come, and Litecoin traders can be positioned to capitalize on the resulting price movement.
LTC- 1-Day Chart
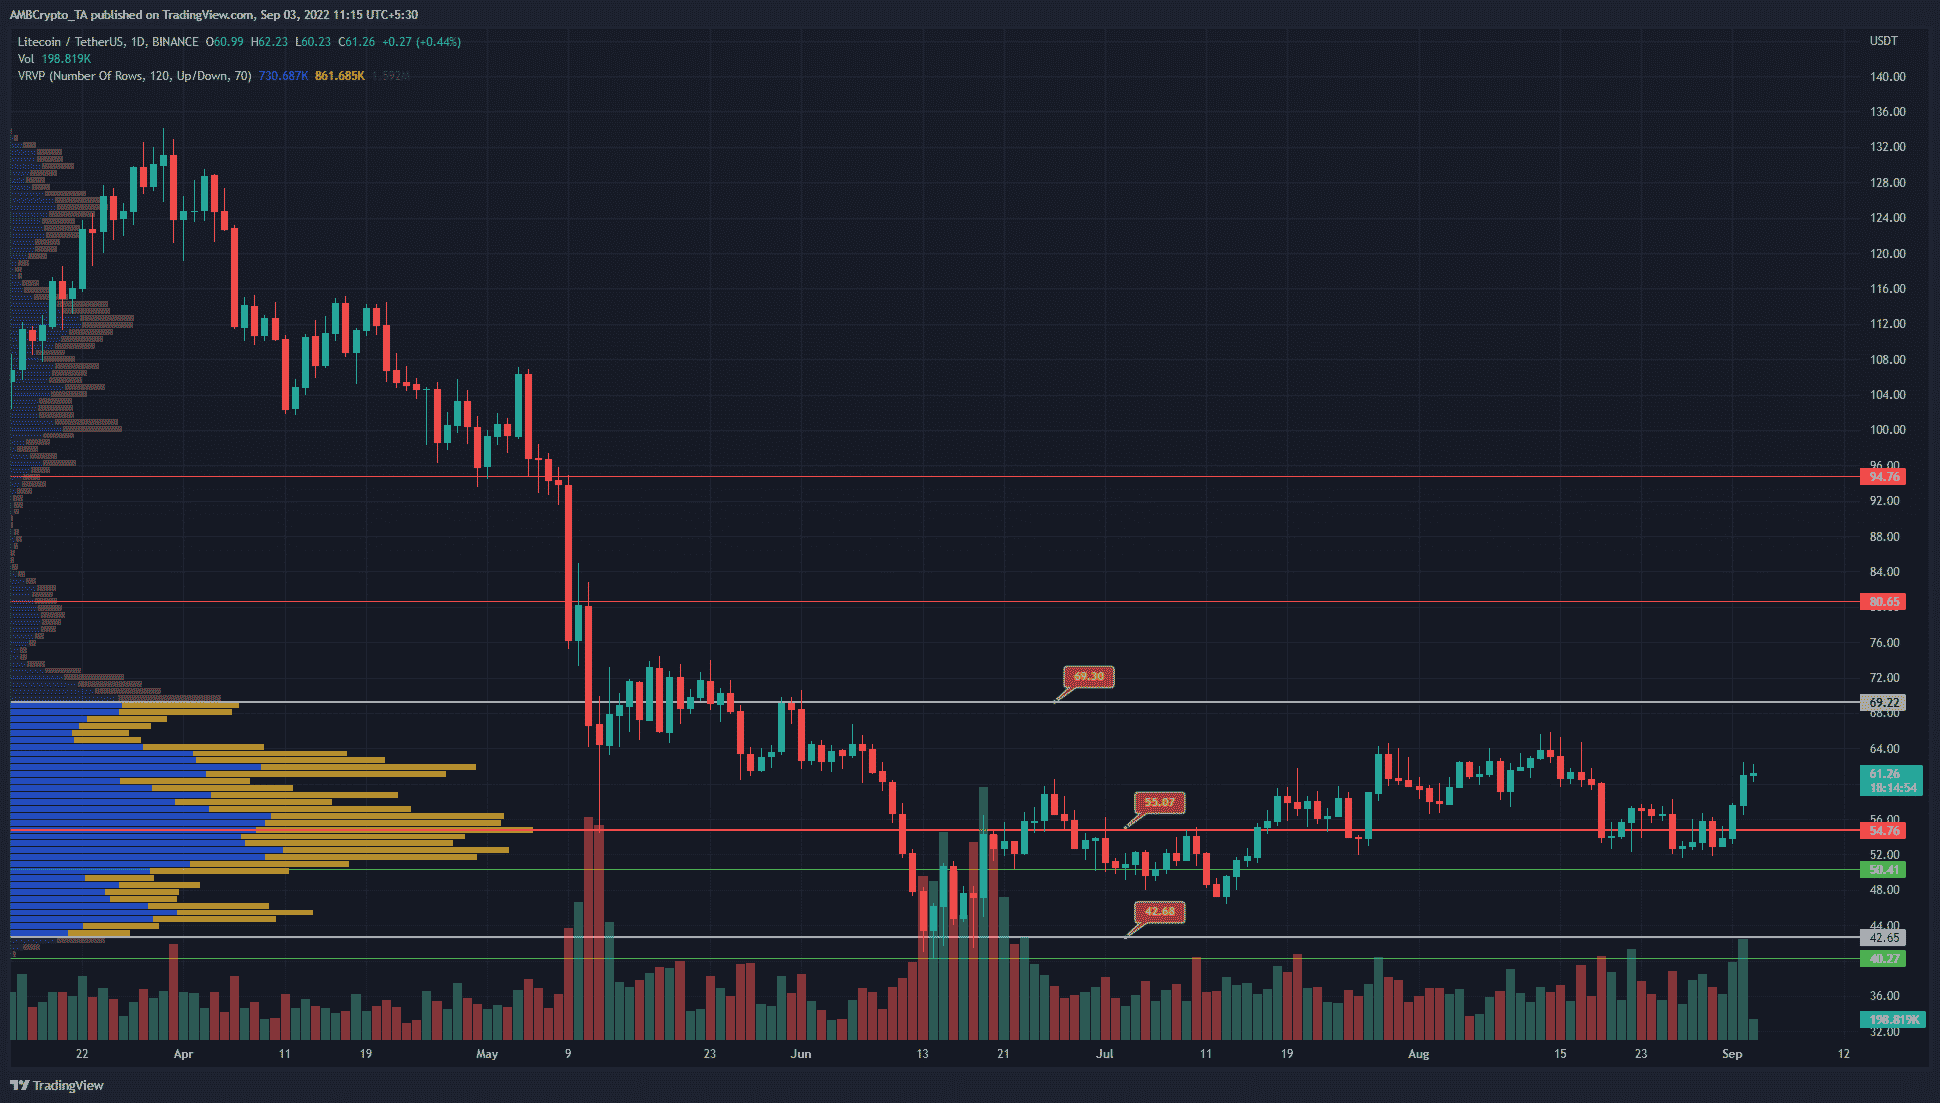
The Volume Profile Visible Range showed the Point of Control (red) to lie at $55.07. The Value Area Low and High lay at $42.68 and $69.3 respectively. The volume tool highlighted that a large portion of the trading activity since June has been within the extremes marked on the chart.
Since June, the price has formed a range between $65 and $43.4, values that are quite close to the VAH and VAL. At press time, LTC exchanged hands at $61.26 per coin and there was some momentum upward based on the past few days of trading.
It was likely that the $65-$69 region would firmly oppose bullish intentions, and a test of this zone could offer opportunities to sell or short Litecoin. A stop-loss above $70 can be considered, with a take-profit at $55.1 (PoC) and $42.6 (VAL).
Rationale
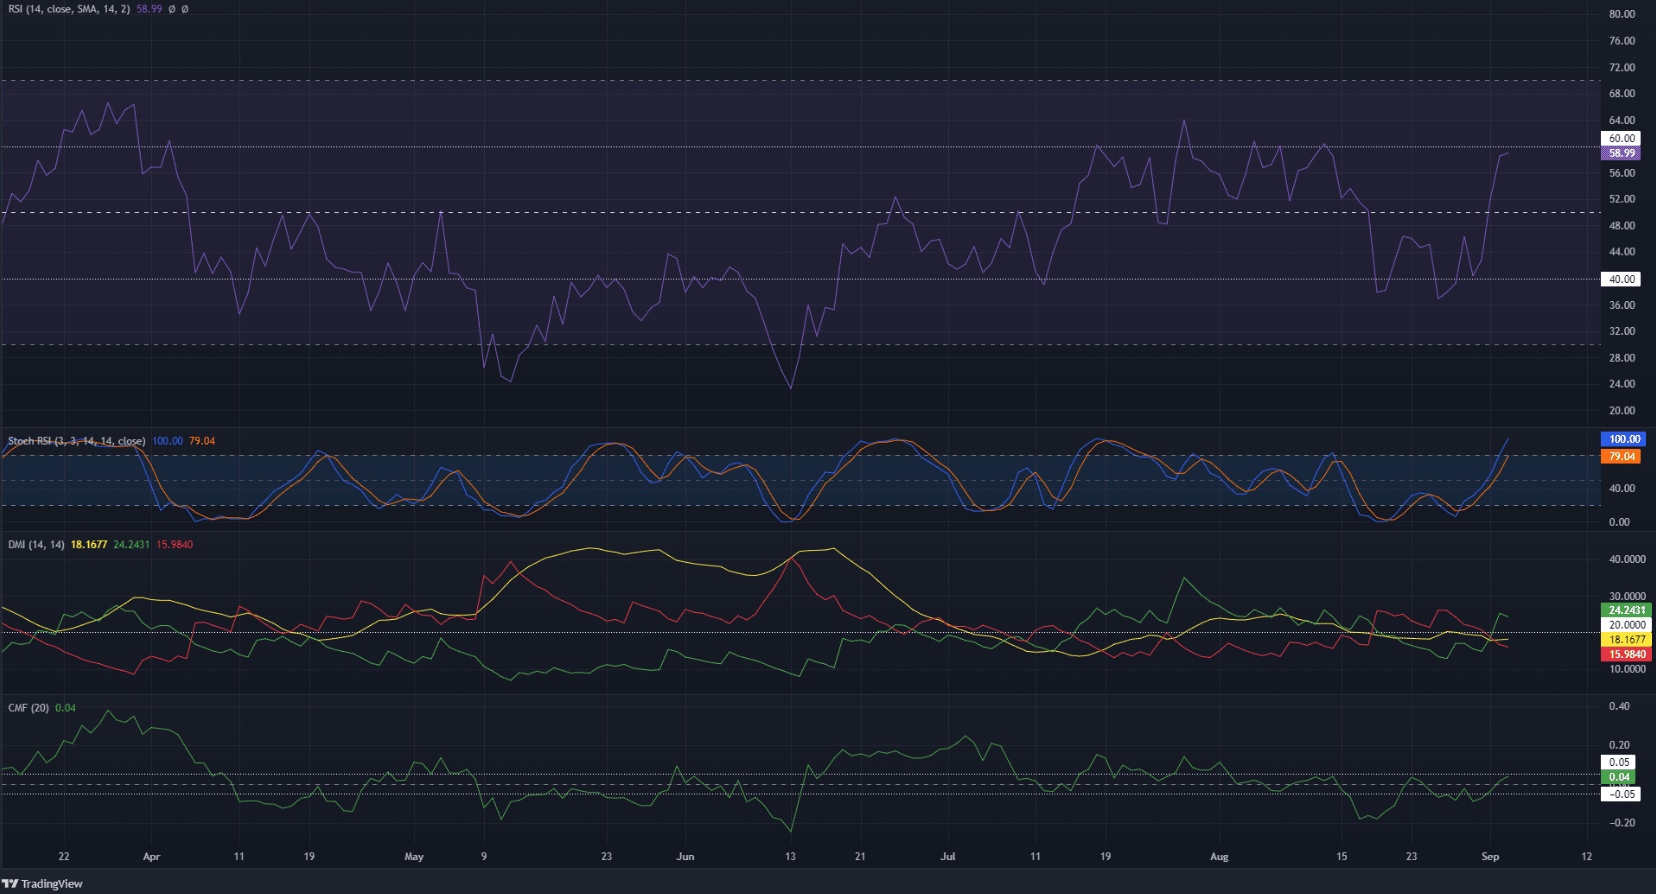
The Relative Strength Index (RSI) has been stuck within the 60 and 40 and has been since July. This was indicative of the formation of a range for an asset. At the time of writing, the RSI approached 60 and could face rejection in the 60-65 band. The Stochastic RSI approached the overbought territory as well.
The Directional Movement Index (DMI) also supported the idea of a range formation. The Average Directional Movement Index (ADX) was unable to climb above the 20 mark and stay there in recent months. This indicated the lack of a strong trend behind Litecoin. The Chaikin Money Flow (CMF) has also stayed in the neutral area around 0, or beneath the -0.05 mark.
Conclusion
Taken together, the indicators showed a lack of strong trend behind Litecoin and also some selling pressure in recent weeks. It did not yet appear likely that LTC would be able to break above the $69 resistance. Bitcoin was at a perilous spot for bulls as well. Hence, a sharp downward move for LTC can not be ruled out in the coming weeks.