Litecoin’s will leave its near-term trend behind, but only after…
Disclaimer: The findings of the following analysis are the sole opinions of the writer and should not be considered investment advice
Litecoin’s (LTC) previous rally saw decent gains that halted at the $114-mark. This level corresponded with its trendline resistance (white). Since then, LTC has dipped below its Point of Control (POC, red). At press time, it was endeavoring to challenge its resistance.
A convincing close above the $106-zone would provide LTC bulls enough thrust to challenge the $109-$111 range resistance. While the 20 EMA (red) offered immediate support, the $105 horizontal support coincided with the trendline support (white, dashed).
At press time, LTC was trading at $106.1.
Litecoin 4-hour chart
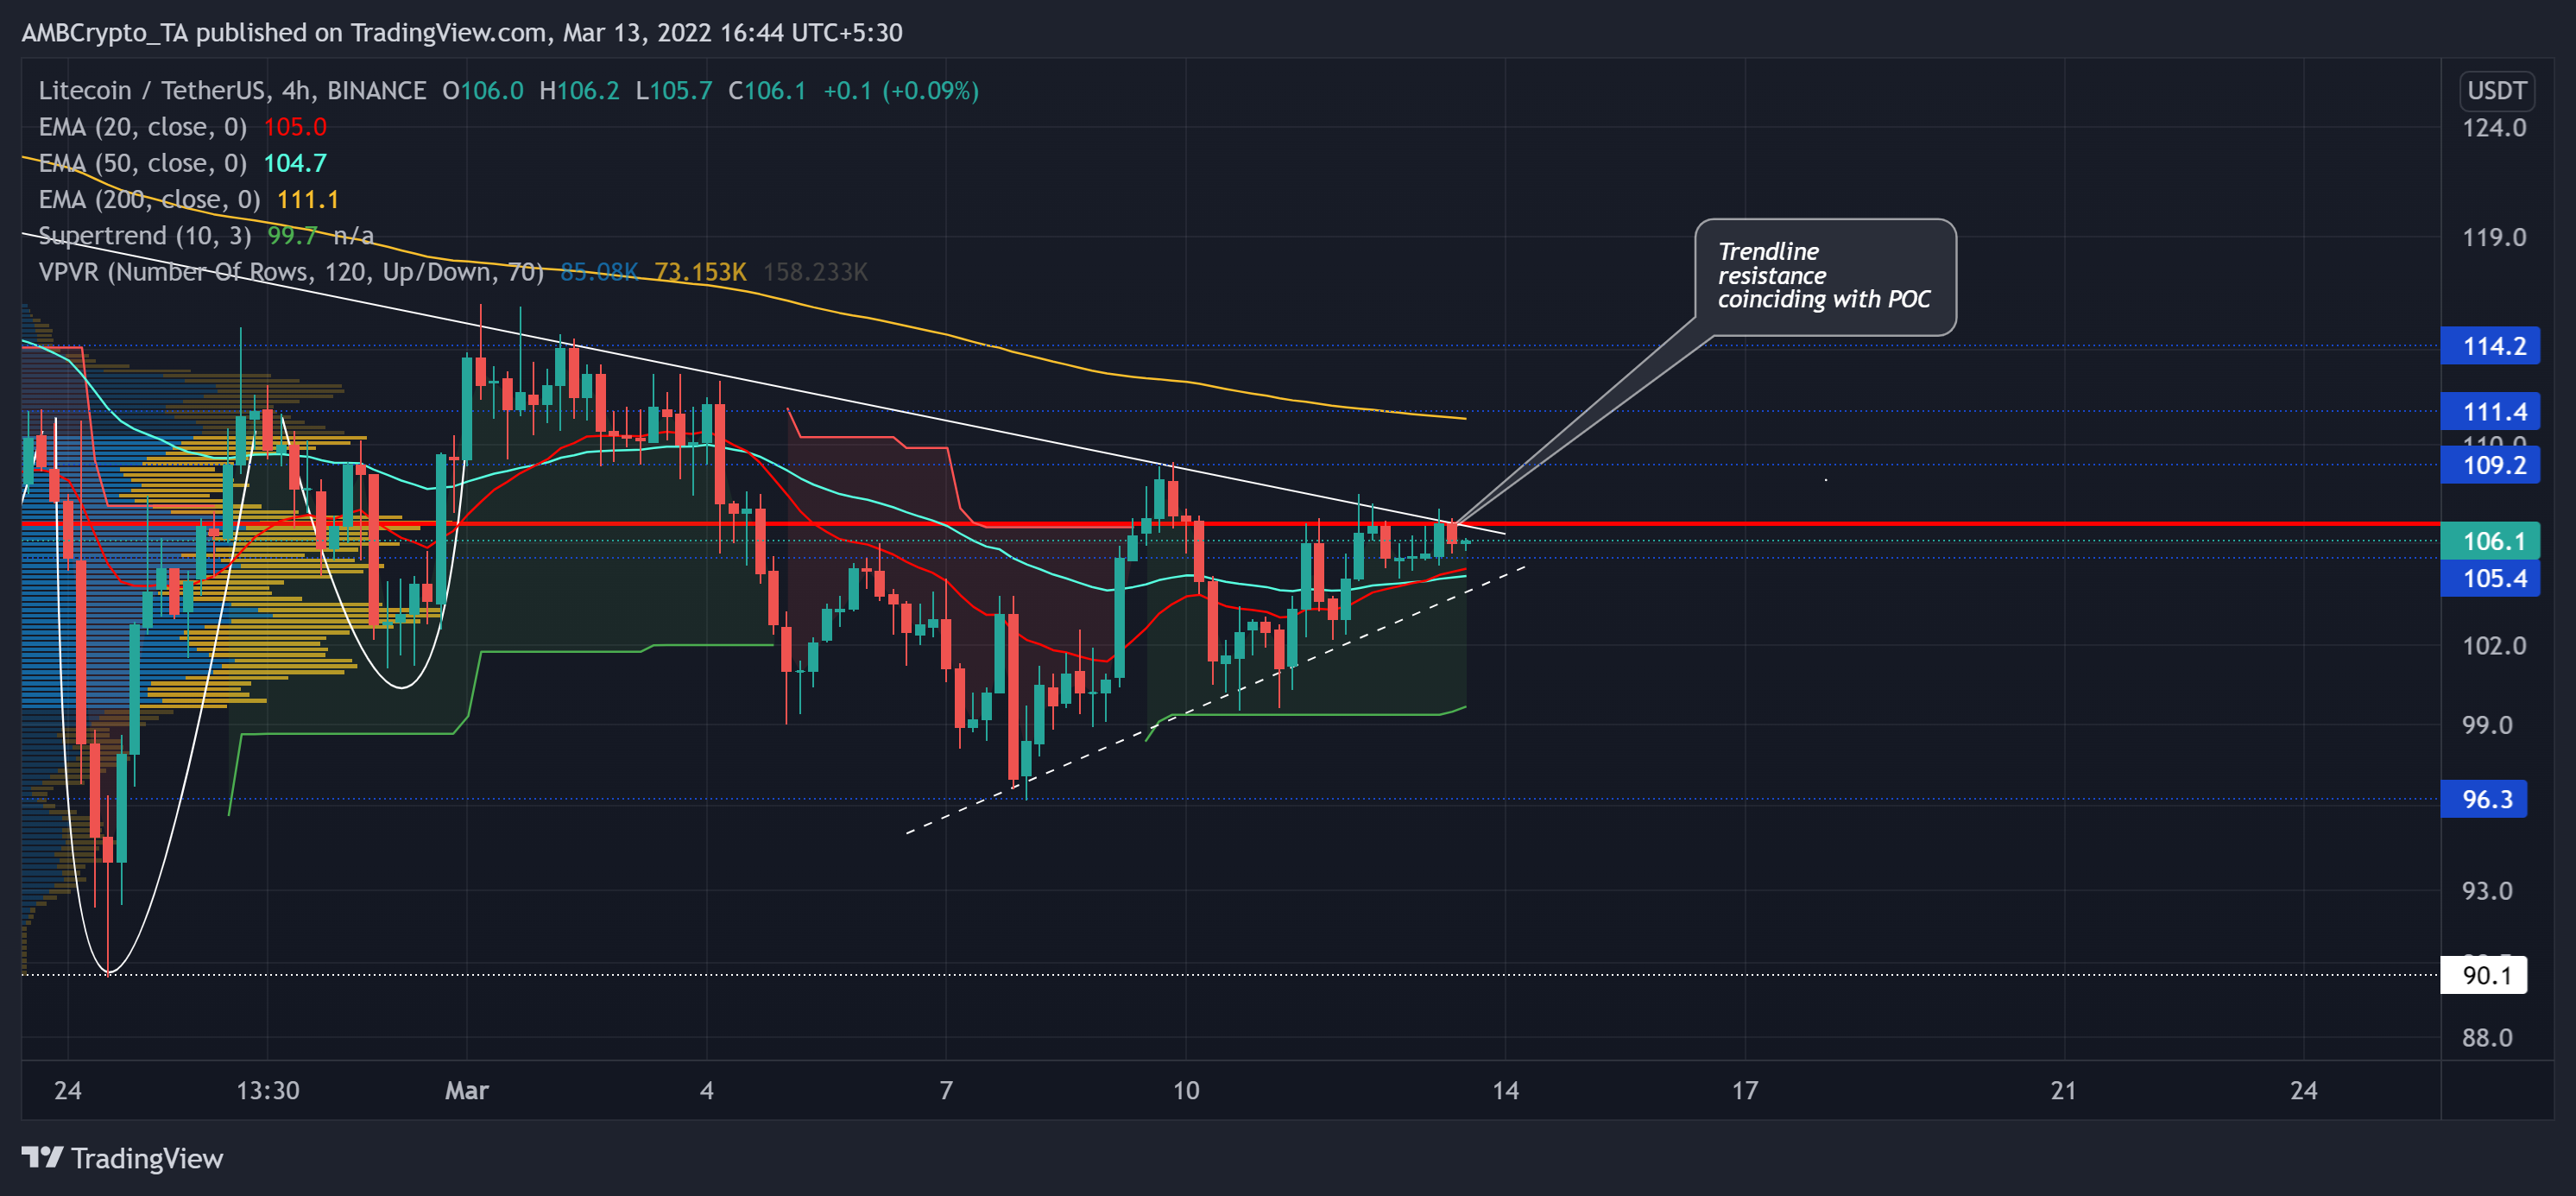
The buyers stepped in at the 15-month-long support near $90. The altcoin registered an over 28.7% ROI from its 64-week low on 24 February. Despite these gains, LTC bulls struggled to overturn the trendline resistance and kept marking lower peaks.
As it endeavored to recover its previous sell-off loss, it found a close above its 20 SMA (red) and 50 SMA (cyan). Also, the 20 SMA undertook a bullish crossover with its 50 SMA. This hinted at an increasing buying influence.
From here on, the $105-zone could keep offering strong support for the buyers whilst they attempt to break above the POC. Snapping the trendline resistance and POC would be critical to stalling the heightened sell-off over the past few weeks. On the flip side, should the bulls dwindle, a close below its near-term EMAs before a lift-off should not surprise investors/traders.
Rationale
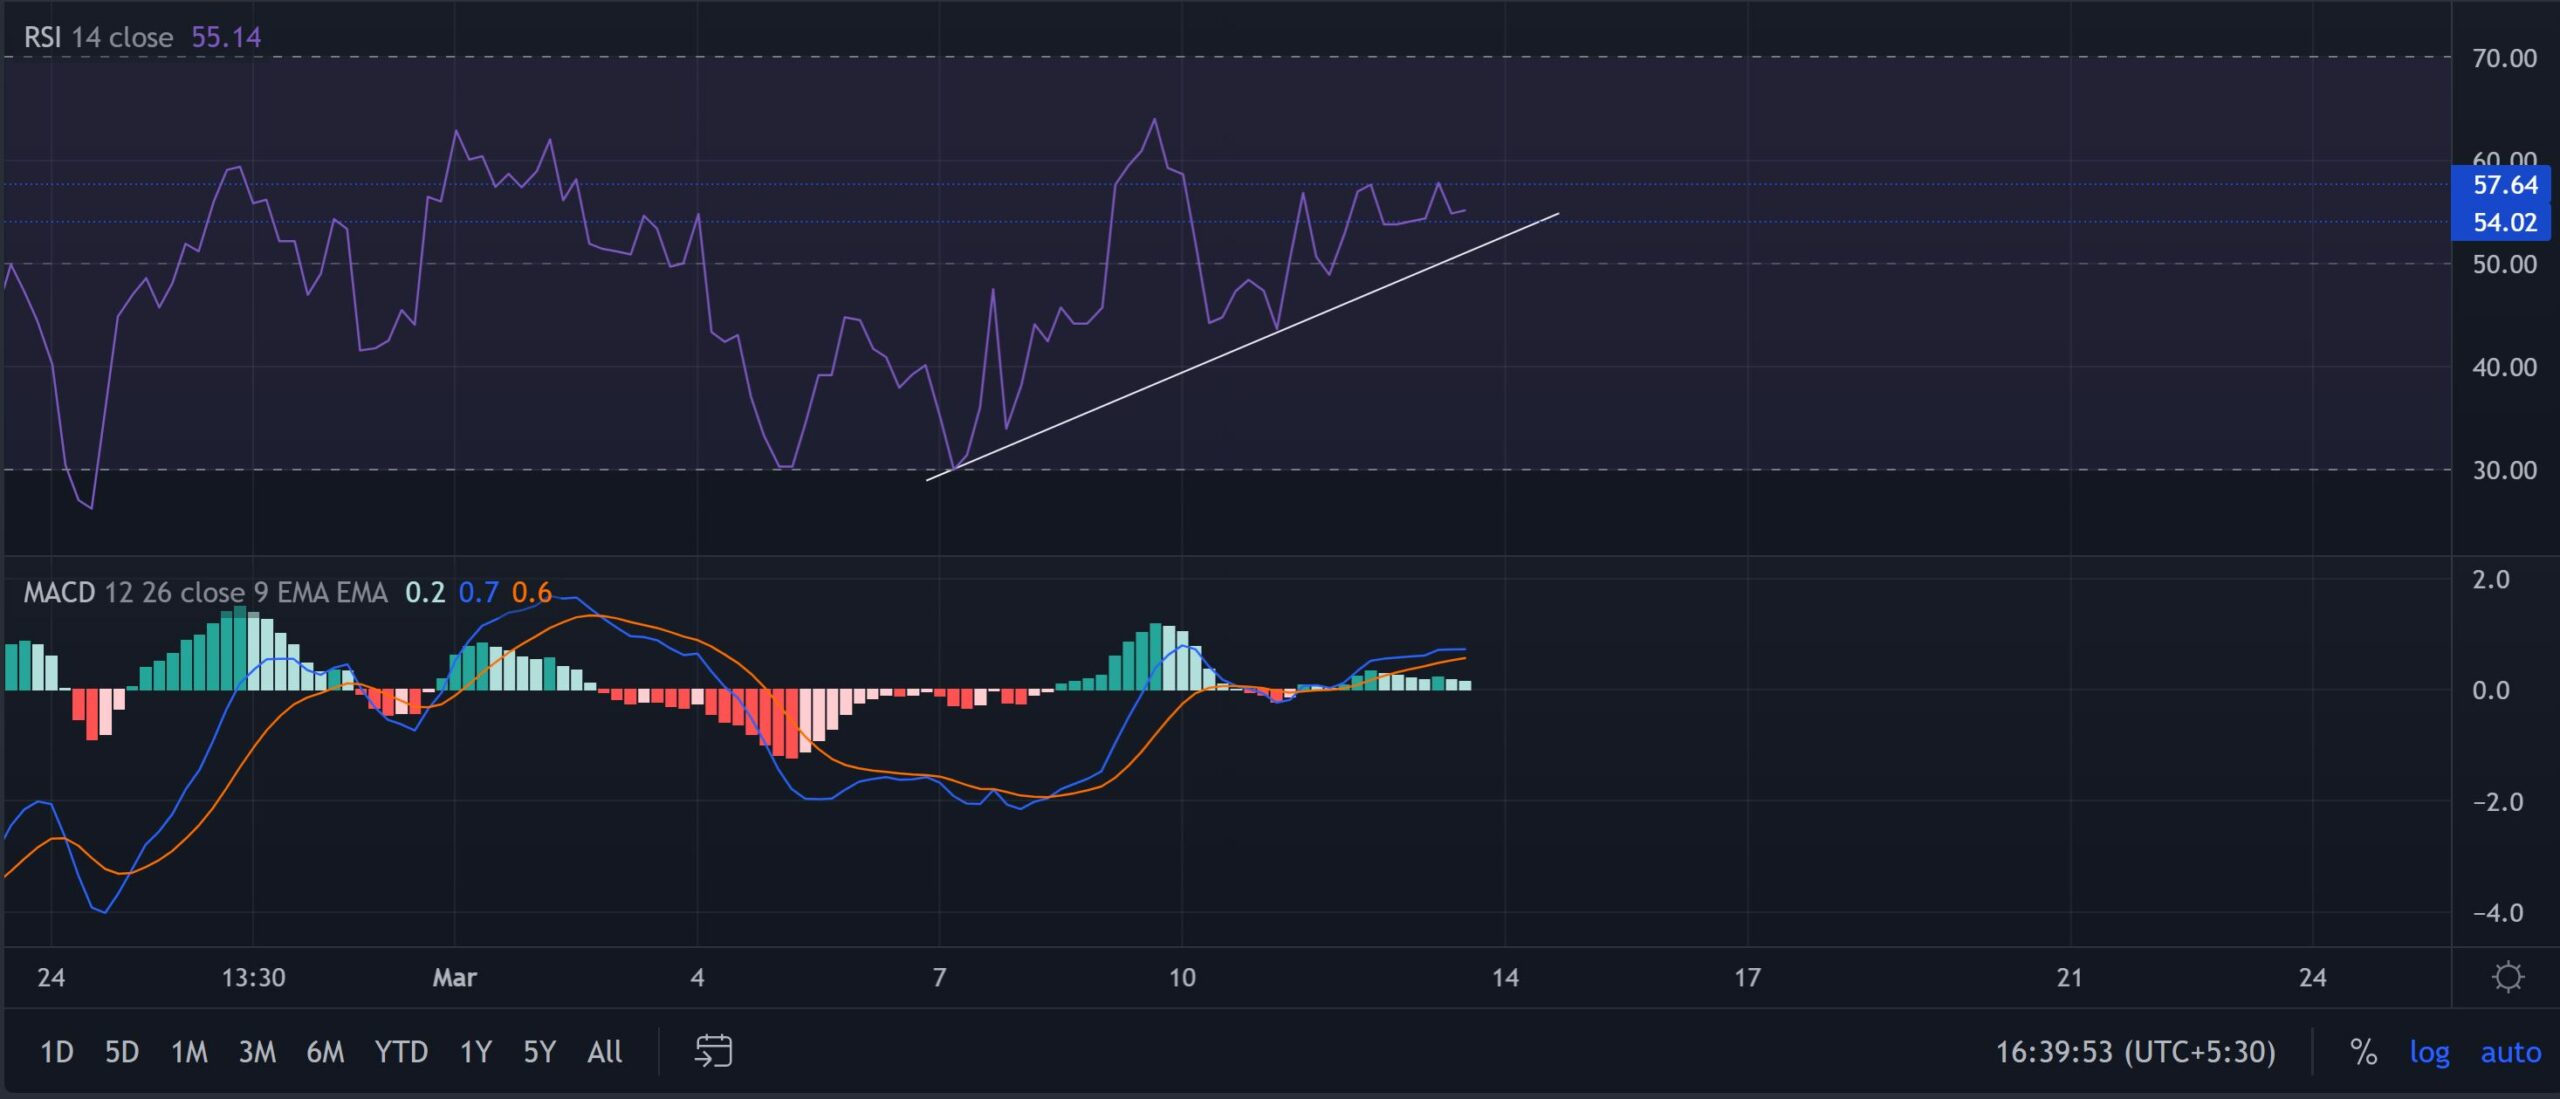
The RSI has been on a roll since picking itself up from the oversold region. It found a strong close above the midline and eyed a retest of its ceiling at the 57-mark. While it projected a bullish preference, the 54-point mark offered strong support.
The MACD histogram entered into a tight phase, but its lines were above the midline, reaffirming the bullish vigor. Meanwhile, the Supertrend continued to be in the green zone.
Conclusion
As the northbound 20 SMA jumped above the 50 EMA, the chances of near-term bullish movements were high. But the buyers need enough thrust to still find a sustainable close above its POC.
Litecoin shares a 74% 30-day correlation with the king coin. A close eye on Bitcoin’s movement would be imperative to not make a call only based on the standalone technicals of the alt.