LUNA, AVAX, Tron Price Analysis: 27 February

As the crypto-market recovered over the past two days, LUNA tested the 78.6% Fibonacci resistance while entering into an overbought position. Avalanche saw decent gains over the last few days as it swayed above its 20-50-200 SMA.
For Tron, the $0.06-mark would be crucial to determining the chances of a possible breakout of the current pattern.
Terra (LUNA)
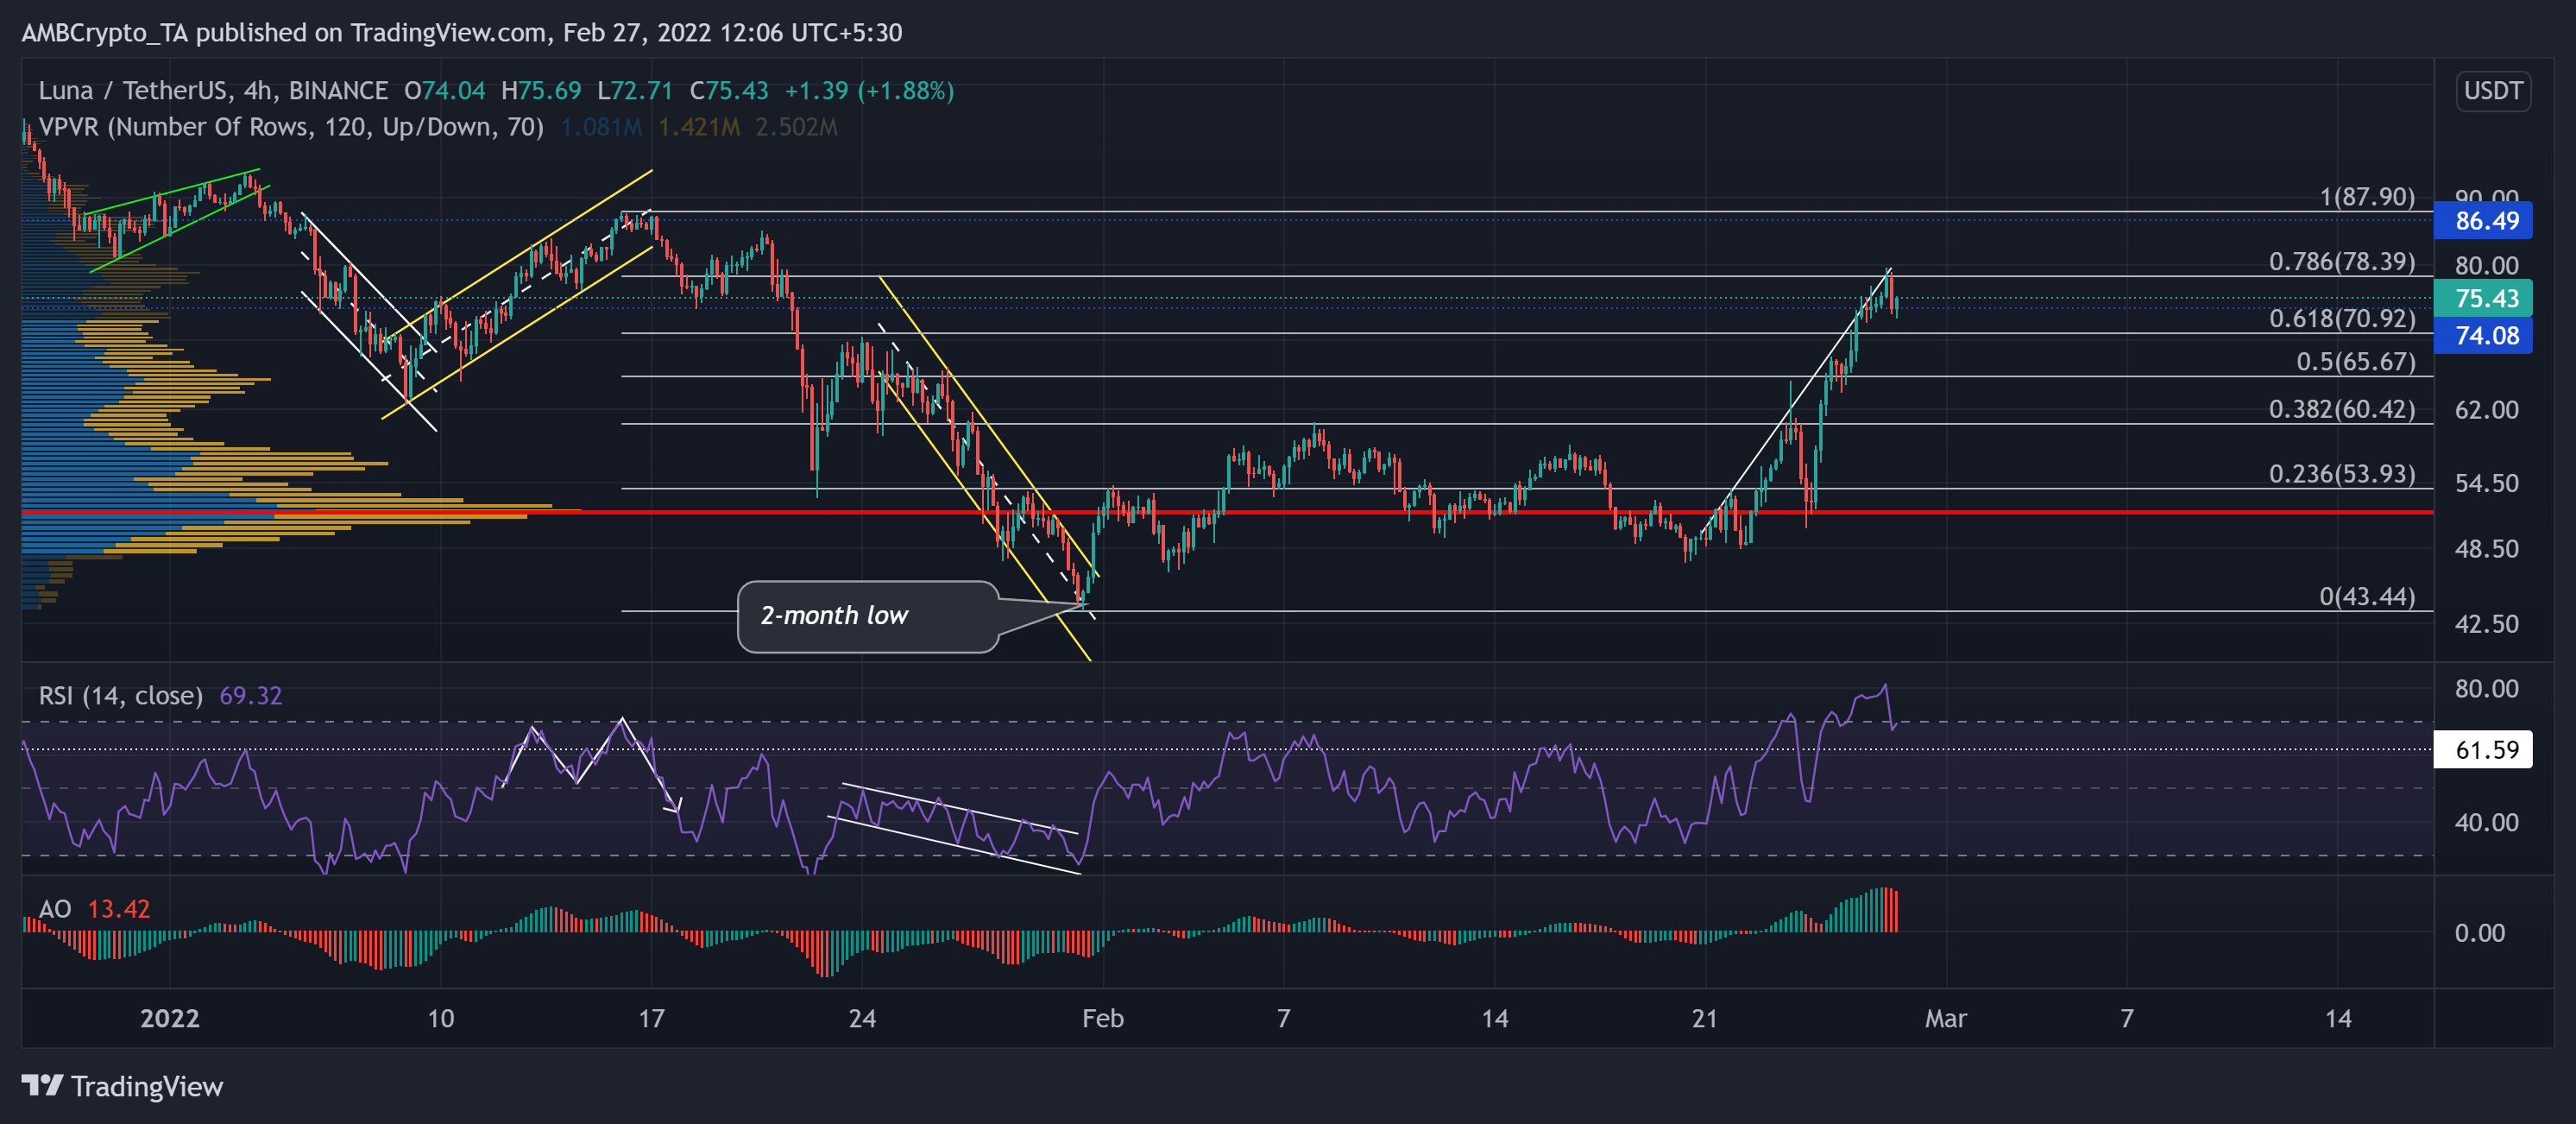
After breaking down from the up-channel from the $86-mark, LUNA witnessed a 50.11% fall (from 17 January) towards its two-month low on 31 January. Following the same, the alt entered into a recovery phase after a patterned breakout and tested the 38.2% Fibonacci level.
Meanwhile, it maintained the Point of Control as an important area of value where the buyers kept defending the $51-zone.
However, LUNA saw exceptional gains of over 50% in just the past week. Thus, it snapped off the crucial 61.8% resistance and tested the $78-level. Now, the $70-$74-range would offer immediate support before a stronger pullback.
At press time, LUNA was trading at $75.43. The RSI stood sturdy at the brink of the overbought mark. Any reversals could find a floor near the 61-mark. After touching its record high, the AO displayed slowing signs on the 4-hour chart.
Avalanche (AVAX)
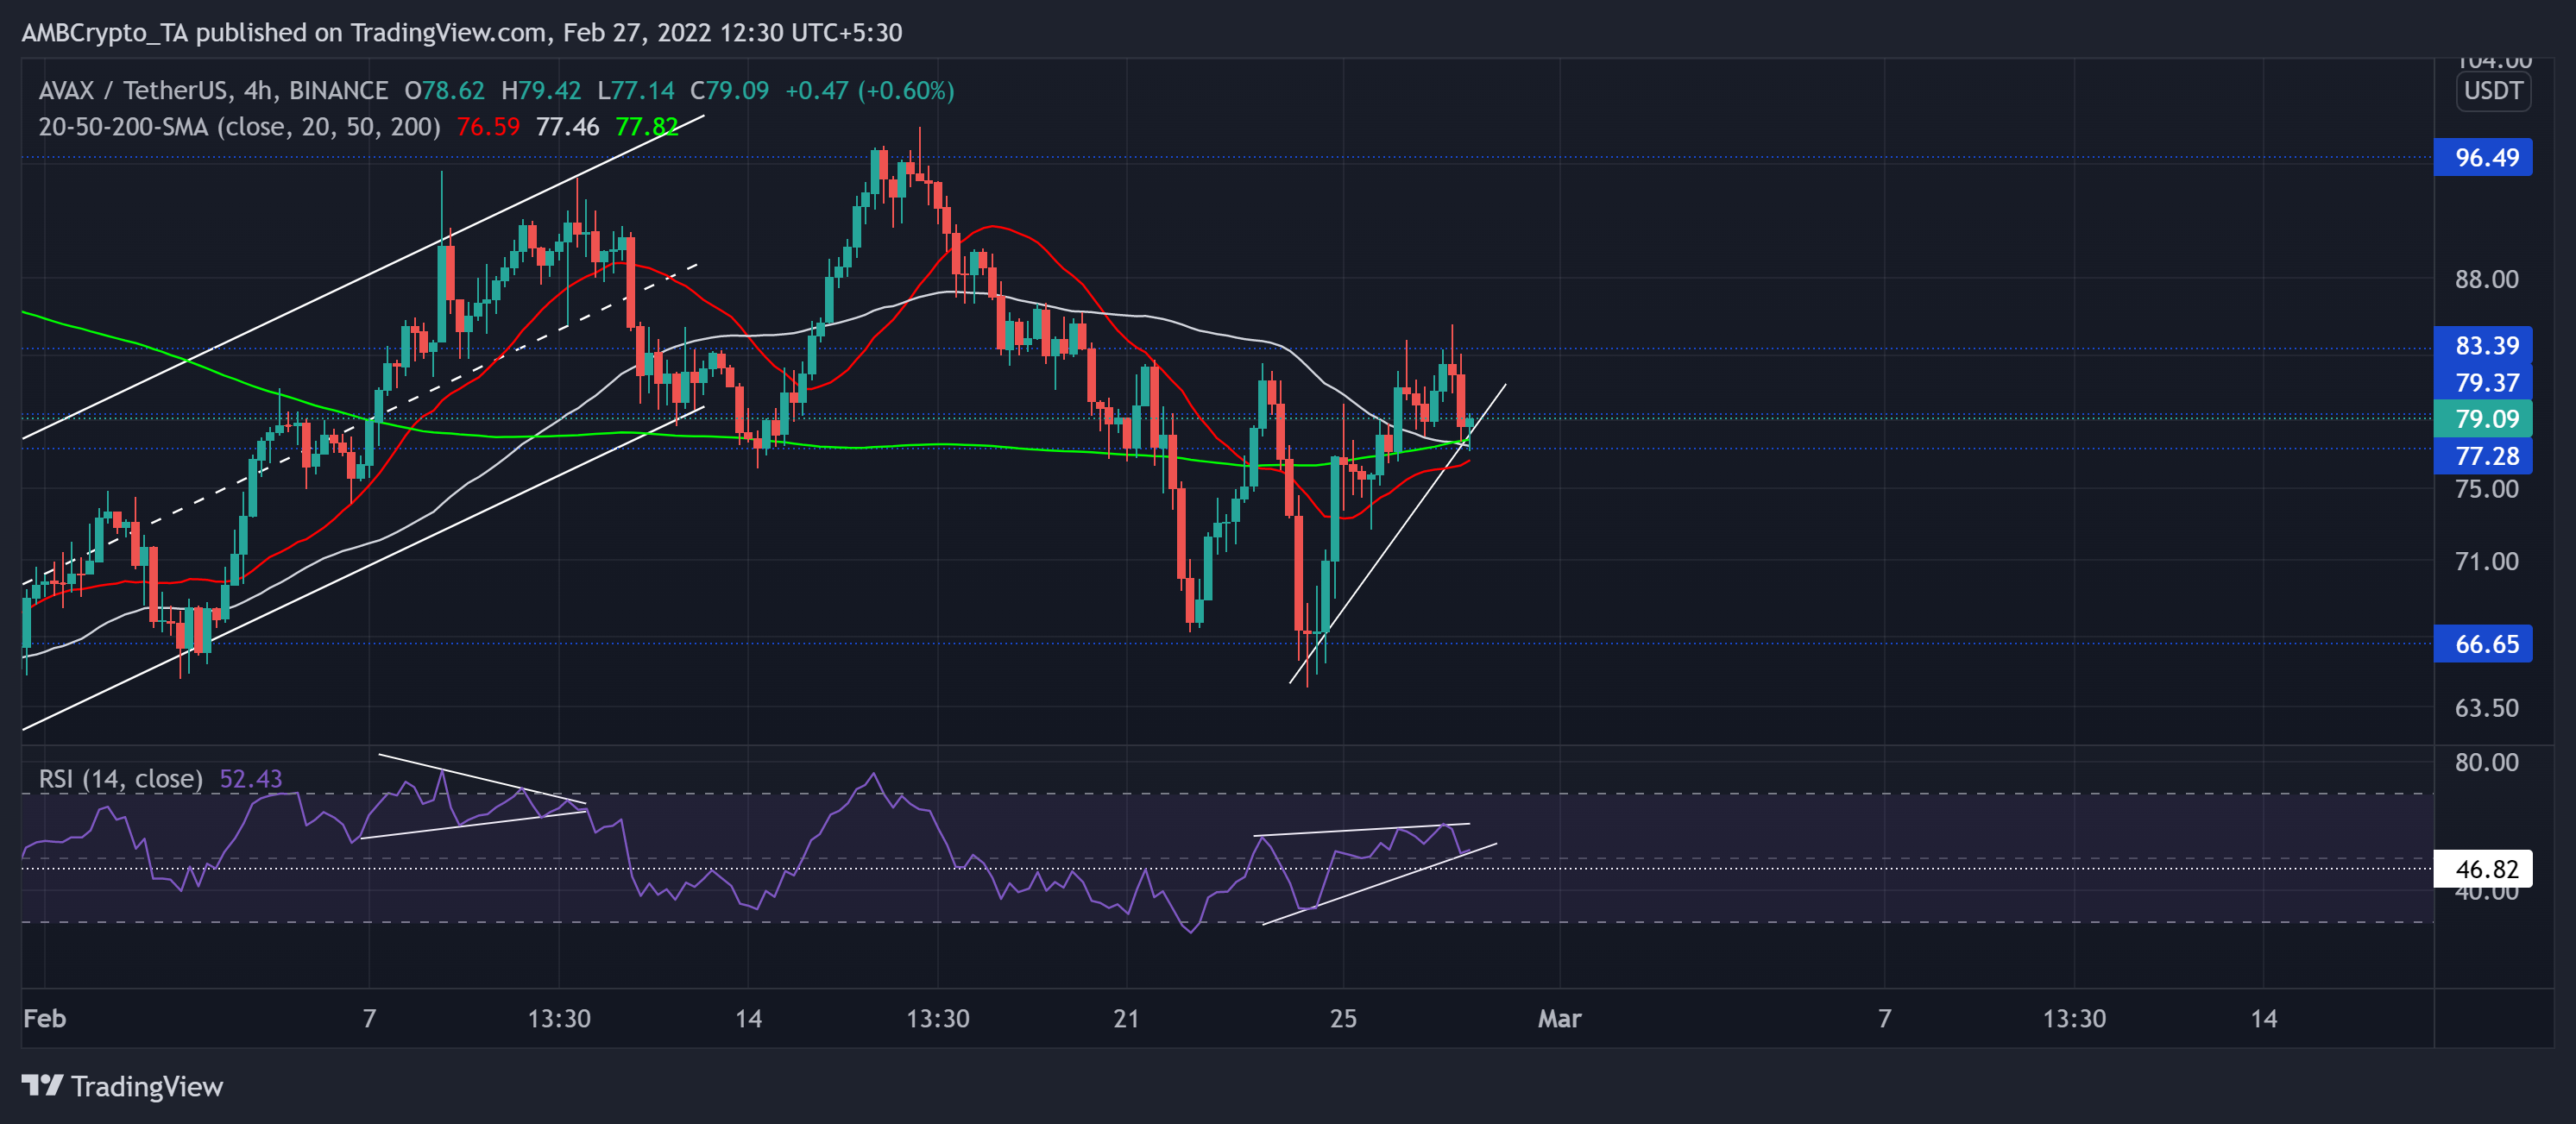
Since hitting its 14-week low on 22 January, AVAX noted staggering 86.5% gains until 17 February.
Since then, it has seen a setback and breakdown from the up-channel. Even so, it kept testing the $77-$79-range until a strong pullback led the alt to lose this range. Now, as the bulls keenly defended the $66-support, any close above the $79-mark could propel a re-test of the $83-mark.
However, as the 50 SMA (grey) jumped below the 200 SMA (green), AVAX could see a further pullback.
At press time, AVAX traded at $79.09. As it hovered in the 52-region, the slightly bullish RSI grew in a rising wedge over the last few days. While the upper trendline of the wedge assumed resistance, a potential breakdown would find support at the 46-mark.
Tron (TRX)
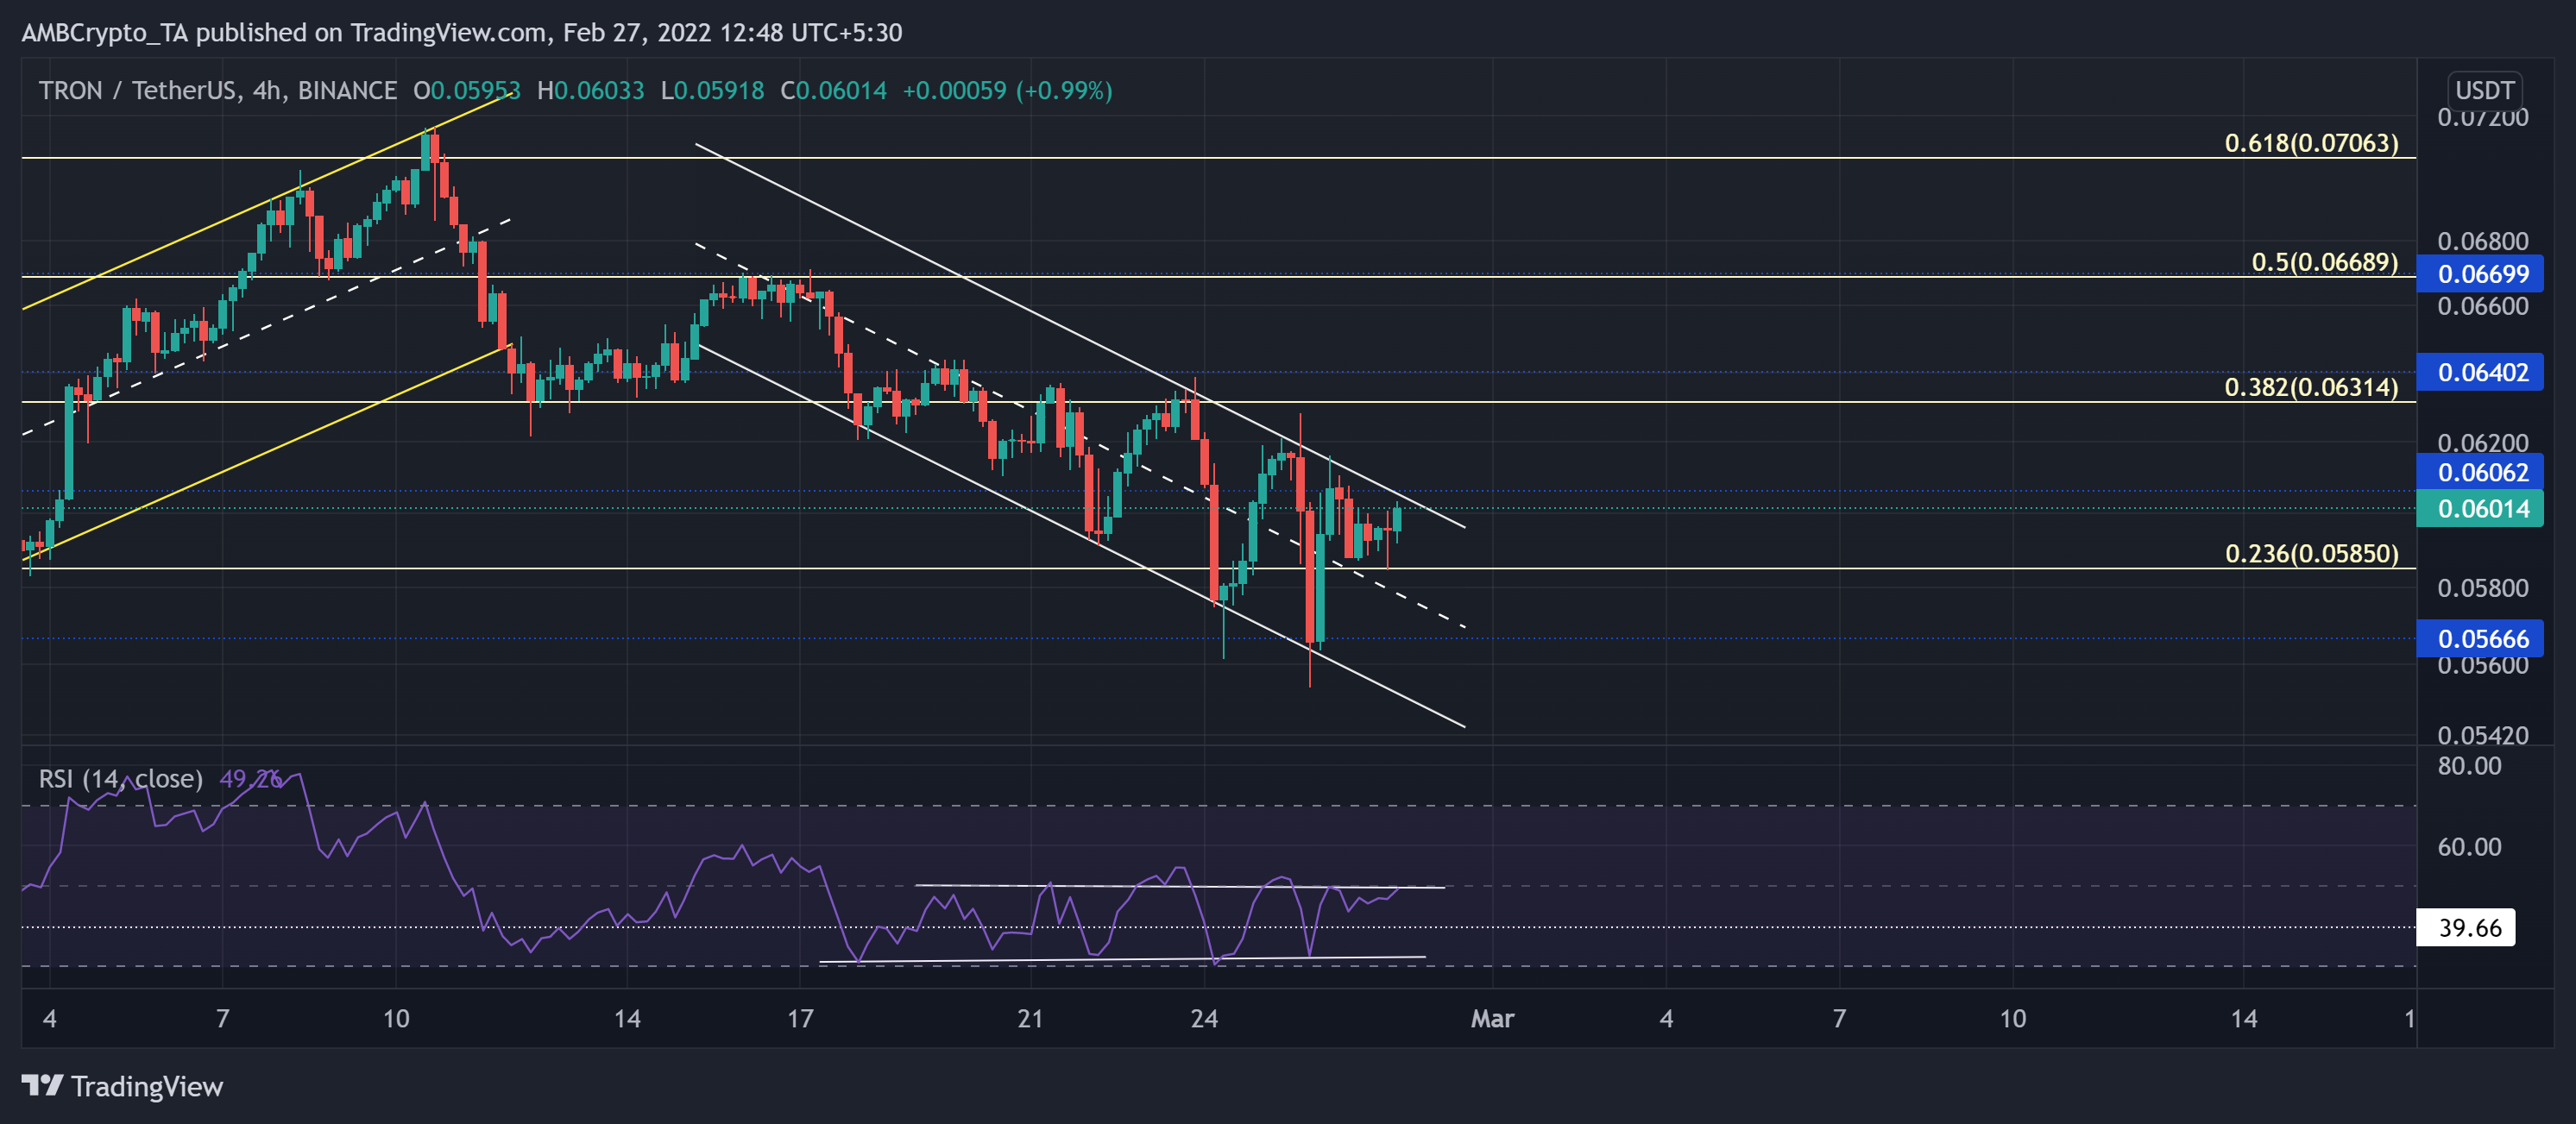
While recovering from its six-month low on 24 January, TRX grew in an ascending channel (yellow) on its 4-hour chart.
It registered nearly 40% gains to retest the 61.8% Fibonacci resistance on 10 February. Since testing this level, the altcoin has been on a steep downtrend. From here on, the immediate resistance stood at the $0.06-level that coincided with the upper trendline of the down-channel. Also, the near-term technicals displayed a bearish edge while the buyers strived to improve their influence.
At press time, TRX traded at $0.06014. The RSI moved sideways over the last week while the price action sharply declined. Any close above the midline could propel a rectangle top rally.


