Maker bears have emerged; time to exercise caution?
Selling pressure on MKR increased as its exchange reserves and net deposits on exchanges increased over the last few days.

- After a comfortable bull rally, MKR’s price dropped by over 6% in the last 24 hours.
- Though sentiment remained positive, Maker’s market indicators were bearish.
Maker [MKR] has witnessed a substantial increase in its value over the last seven days. However, the spree did not last long, as its 24-hour price chart turned red.
Read Maker’s [MKR] Price Prediction 2023-24
Increasing sell pressure on Maker
Lookonchain’s 21 July tweet revealed that a wallet named a16z deposited MKR to Coinbase. The selling sentiment was also proven by CrypotoQuant’s data, as MKR’s exchange reserve was increasing at press time.
Additionally, its net deposit on exchanges was also higher than the last seven days. The increase in selling pressure could have played a major role in turning the token’s price bearish.
1/ The price of $MKR skyrocketed by ~20% today.
We noticed that a16z has been depositing $MKR to #Coinbase to sell recently.
And CMS Holdings also reduced its holdings of recently accumulated $MKR 2 hrs ago. pic.twitter.com/6AvjWf9NYh
— Lookonchain (@lookonchain) July 21, 2023
As per CoinMarketCap, Maker’s price declined by more than 6% over the last day. At press time, it was trading at $1,088.57 with a market cap of over $1 billion.
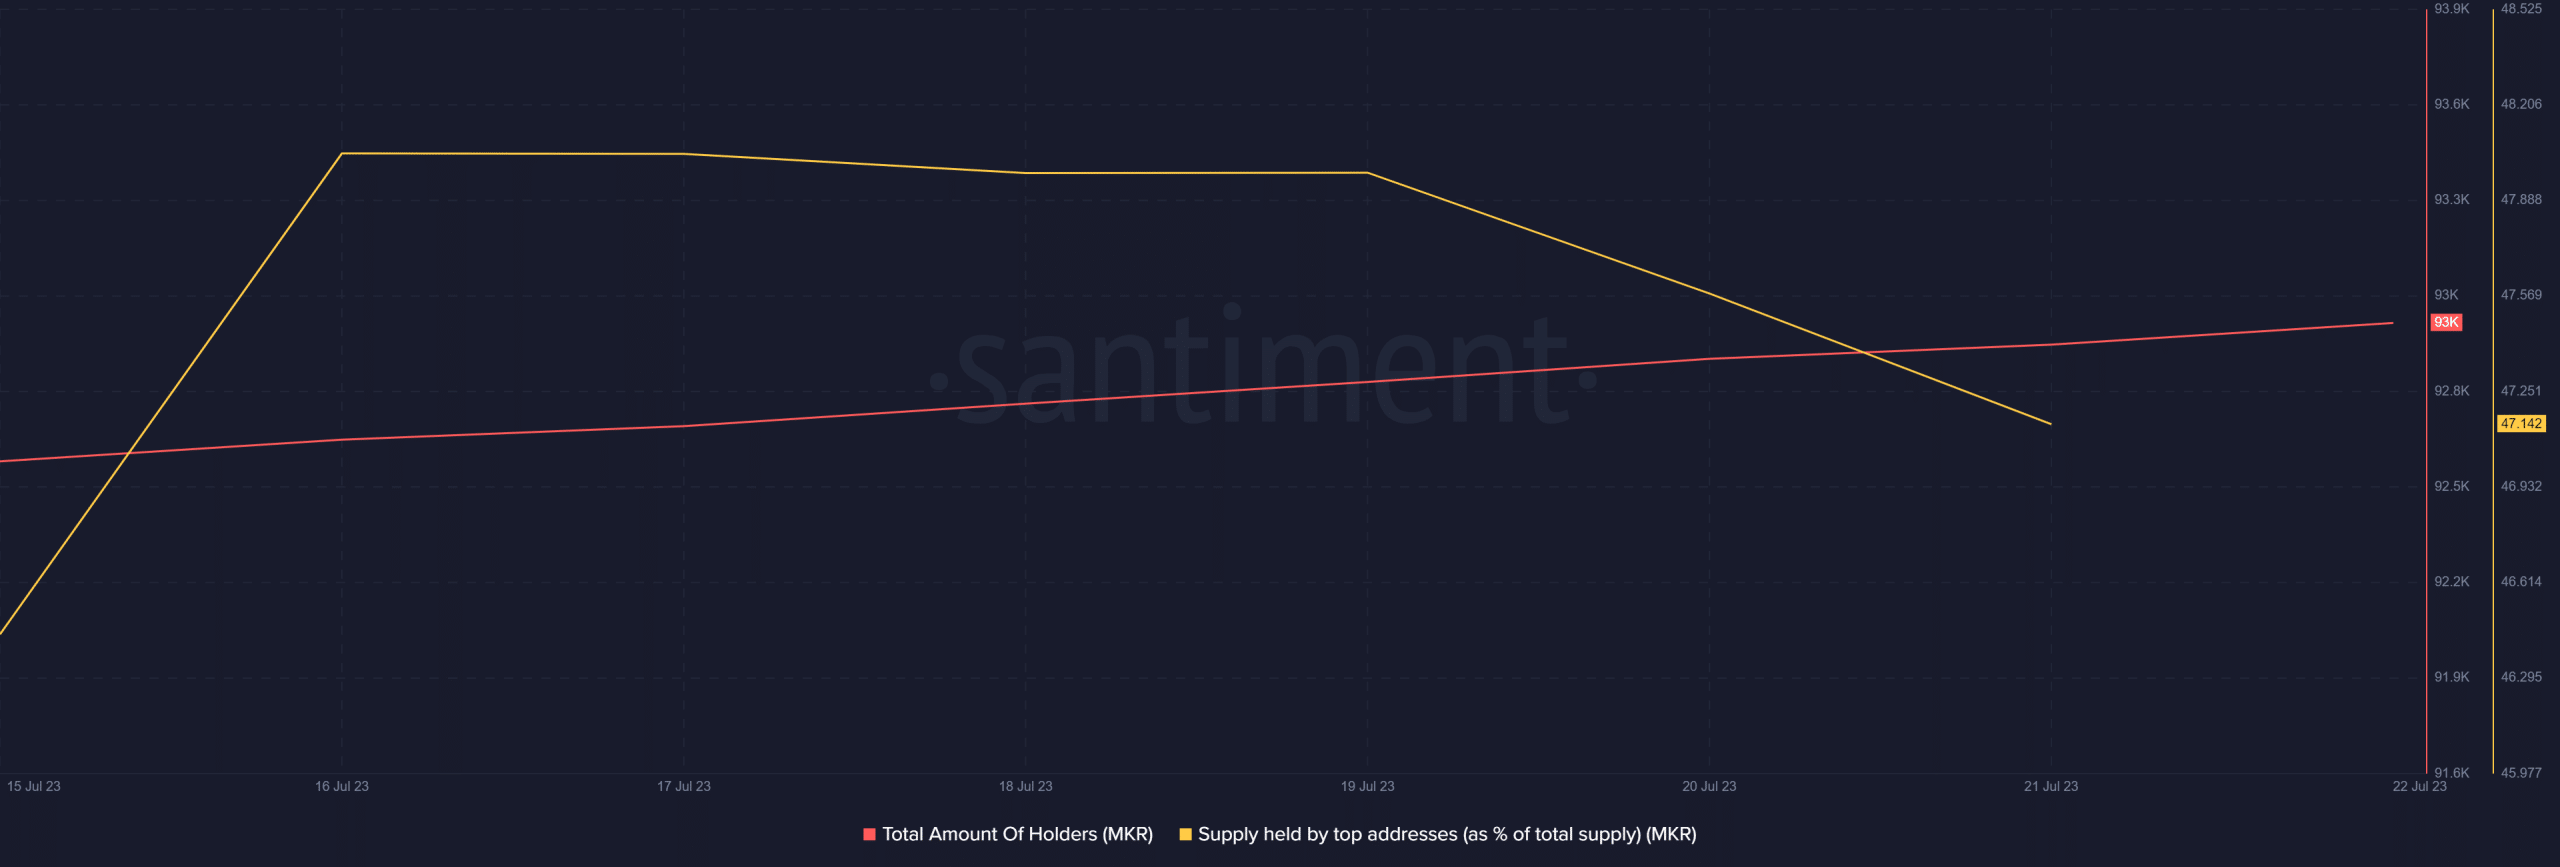
Surprisingly, despite the massive hike in MKR’s price last week, its supply held by top addresses registered a decline. Nonetheless, its total number of holders rose slightly.
Thanks to the price uptick, sentiment around MKR also turned positive, as evident from the rise in its weighted sentiment. Its social dominance also spiked quite a few times last week, reflecting its popularity.
Another positive metric was its MVRV Ratio, which has risen sharply in the last seven days.

Bears take over the market
Not only did CryptoQuant’s data reveal that MKR was under selling pressure, but it also pointed out that Maker’s Relative Strength Index (RSI) was in an overbought zone. This is a bearish signal, increasing the chances of a continued price downtrend.
Realistic or not, here’s MKR’s market cap in BTC’s terms
A look at its daily chart also gave a similar bearish notion. MKR’s Chaikin Money Flow (CMF) registered a downtick. Its Bollinger Bands revealed that after a bull rally, MKR’s price entered a slightly less volatile zone.
Nonetheless, the 20-day Exponential Moving Average (EMA) was still above the 55-day EMA, which was bullish. Another bullish indicator was the Money Flow Index (MFI), which hovered above the neutral mark at the time of writing.