MANA forms a bearish pattern after posting gains in the past week, but…

Bitcoin has been unable to climb past the 39k resistance in the past few days, although it did find some demand at the $36.4k level. In the last 24 hours preceding press time, Bitcoin Dominance has dropped slightly from 41.85% to 41.37% (at the time of writing).
This suggested that the altcoin market has registered slightly more gains in the previous day than Bitcoin (in terms of market cap). MANA saw a bounce in price from $2.45 in the day prior to the time of writing. But the question remained- Was the market turning bearish once more, or was this only a pullback before further gains?
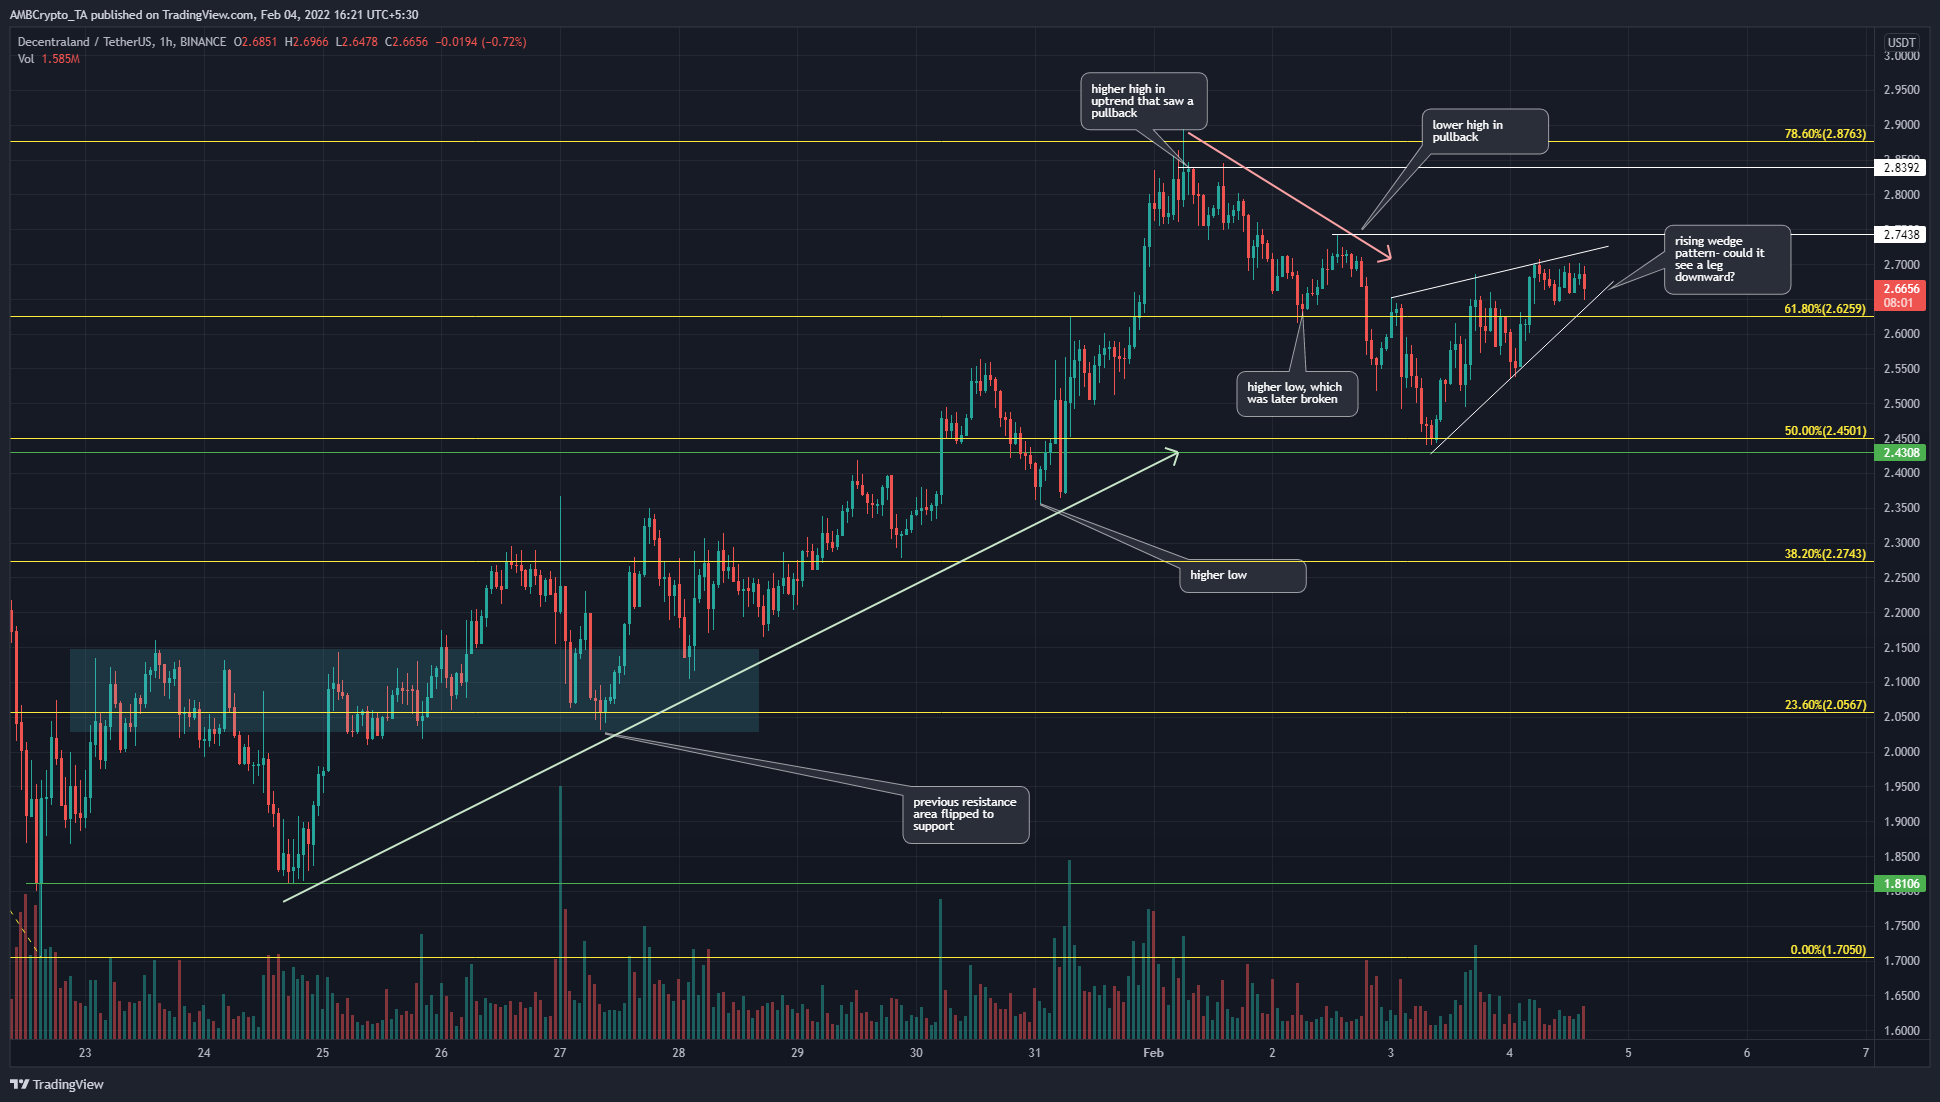
A set of Fibonacci retracement levels (yellow) were drawn based on MANA’s move from $3.19 to $1.7 in January. An area of resistance was identified at the $2.1 zone, which also coincided with the 23.6% retracement level. Subsequently, this area of former supply was flipped to one of demand (cyan box) and the price has climbed steadily to reach $2.87.
The higher high in the uptrend of the past few weeks has been set at $2.83, and MANA saw a pullback to $2.45.
As highlighted on the charts, the price had been on a low timeframe trend upward till it reached $2.83, and shortly thereafter the price broke beneath the $2.62 level as well. This can be taken as a break in the market structure.
At the time of writing, the price was nearing the apex of a rising wedge, shown in white. This suggested that a session close beneath the pattern could see MANA retrace a sizable chunk of its recent gains.
Unless the price can climb back above $2.74, it can be considered as an area where selling opportunities lie in the near term.
Rationale
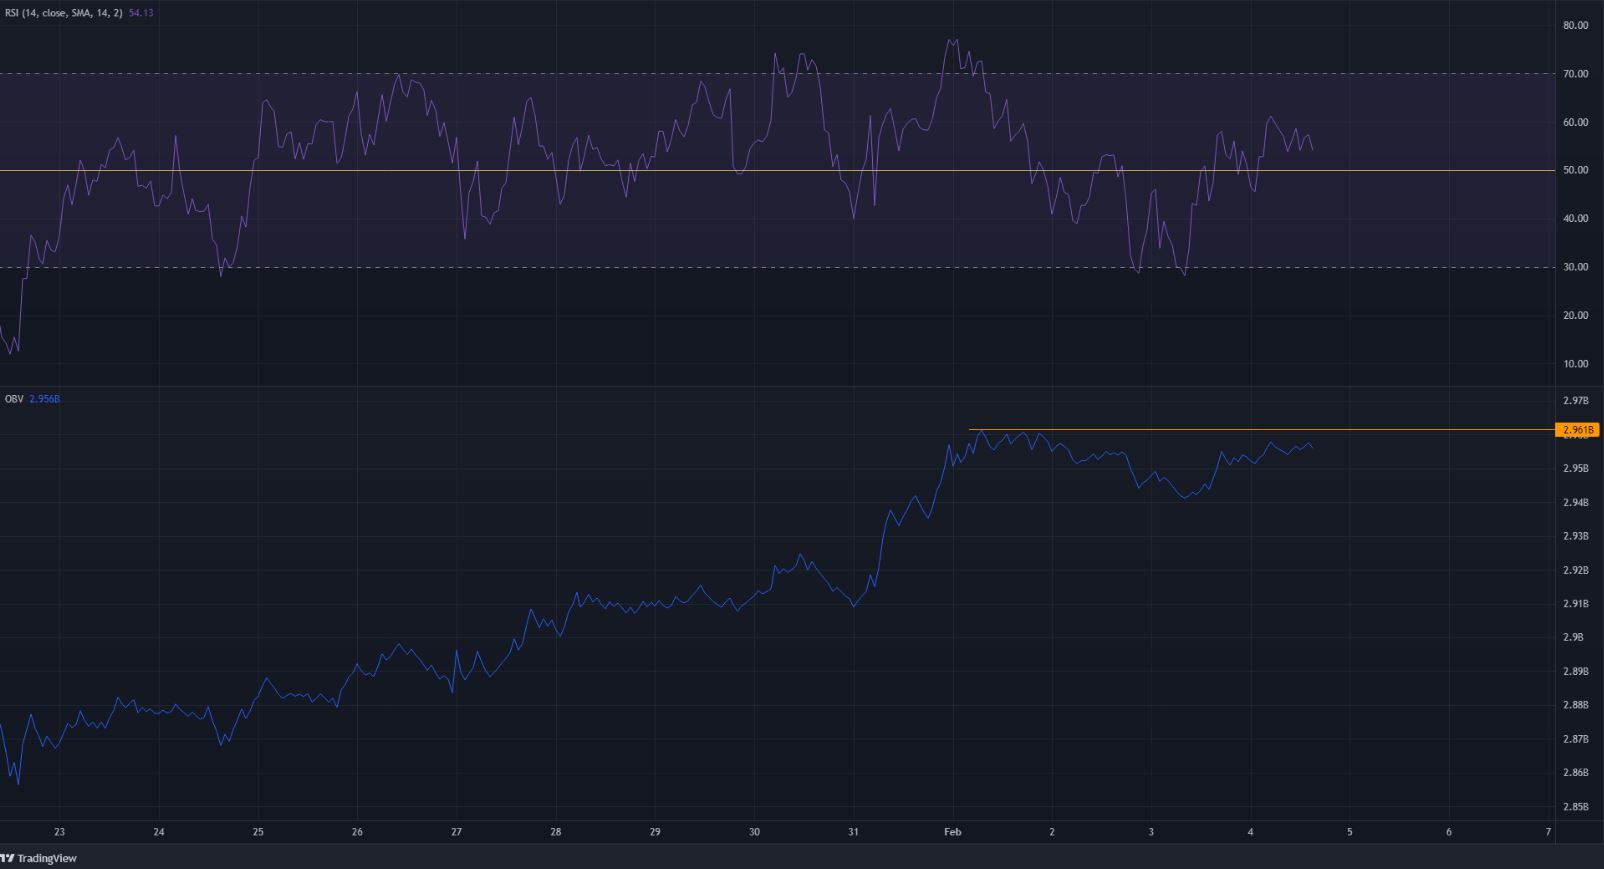
The RSI on the hourly chart climbed above neutral 50 and no divergences were spotted in the time period the price has been trading within the wedge. The OBV showed that after reaching $2.87 MANA has seen some selling volume. A break above the level marked on the OBV could be awaited to lend some strength to the bullish argument.
Conclusion
The $2.74 and the wedge pattern’s lower trendline are levels to watch out for in the coming hours. A move below the pattern could see MANA descend once more.
Disclaimer: The findings of the following analysis are the sole opinions of the writer and should not be considered investment advice


