MANA holders intone ‘could you find a way to let me down slowly’ as…

Disclaimer: The findings of the following analysis are the sole opinions of the writer and should not be considered investment advice
According to data from Coinglass, more market participants were shorting the asset than longing MANA. That means the majority of the market participants had taken a bearish stance on the coin than the bullish side. The market structure was also in favor of the bears. However, a bullish reversal pattern also appeared to be brewing on the charts.
MANA- 1 Hour Chart
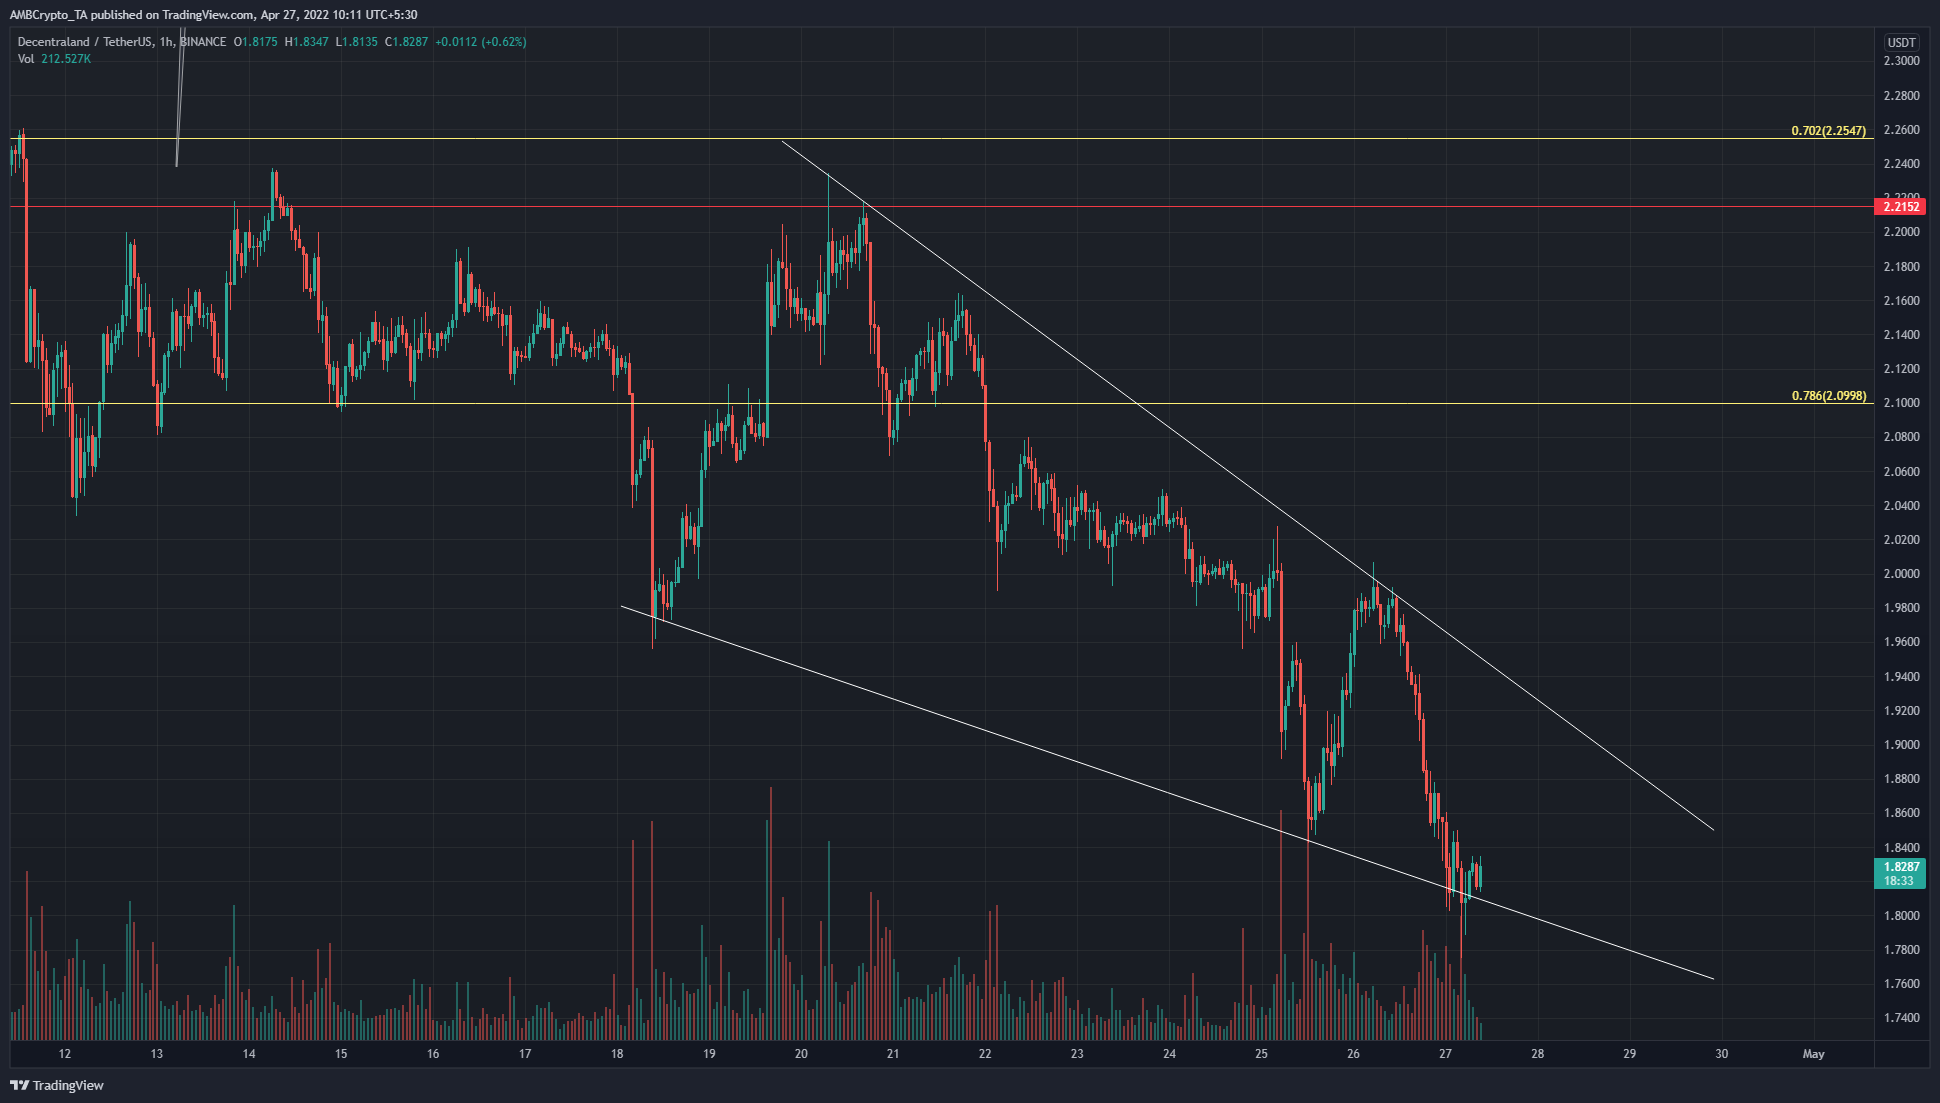
The bullish reversal pattern on the charts was a falling wedge pattern (white). In the past two weeks, MANA had held on tenuously to the $2.09 level of support but slipped beneath it in a wave of selling.
After this drop, the $2 area acted as support in the past few days, but this support has also been broken in recent days. Moreover, the $2 level was also retested as resistance and made a lower low on the charts as well.
The price has touched the wedge pattern multiple times now, and a session close above the upper trendline could see a breakout and a move toward $2.1. However, fear still remained in the market, and a weak breakout before new lows could also be a possibility.
Rationale
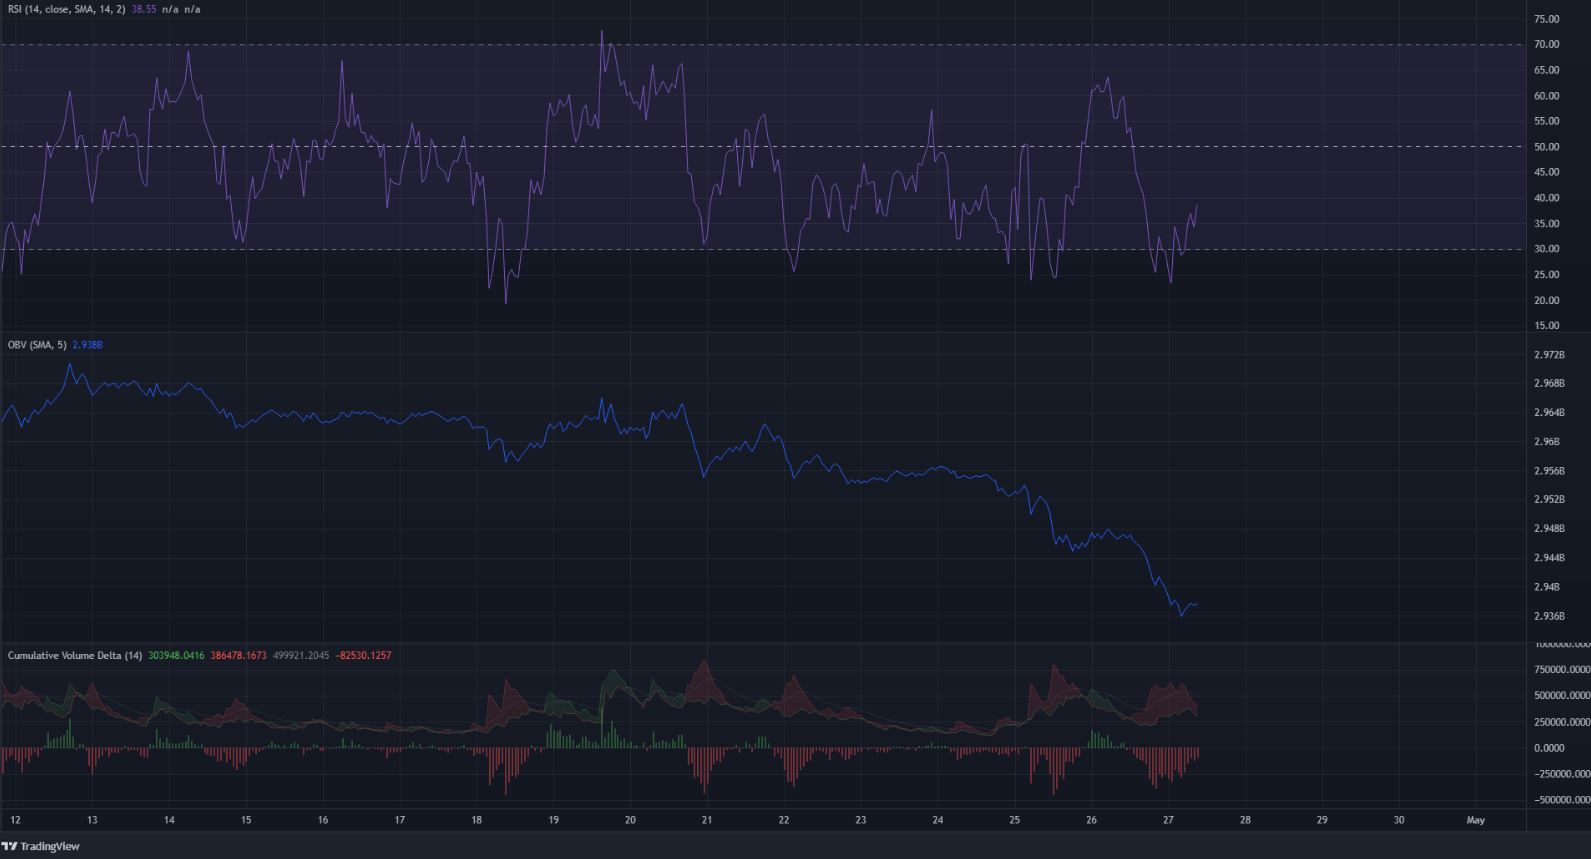
The RSI has been below neutral 50 for nearly a week now, with the rally on 25 April being an exception. This was when MANA bounced from $1.84 to $2, before facing rejection and dropping once again.
The OBV has been on a steep downtrend, which suggested that buyers were nowhere to be seen in recent days. To reinforce this idea, the CVD also registered strong bearish bars in the past few days to indicate that the sellers have been dominant.
Conclusion
The market structure was bearish and the indicators showed strong selling occurred as well. This was likely to continue in the days to come. However, because of the formation of a wedge pattern, a minor bounce toward $2 can not be discounted.


