MATIC could rise toward opposite end of this range and investors should…

Disclaimer: The findings of the following analysis are the sole opinions of the writer and should not be considered investment advice
MATIC dived toward $1.26, but its reversal was just as quick in recent hours. There was not sufficient demand to suggest that the bulls can drive further gains. However, a lot would depend on Bitcoin.
Bitcoin has a similar structure on its own lower timeframe charts, and could easily push toward the $42k and $45k supply areas. This in turn could see Polygon’s native token do well on the price charts, as sentiment in the crypto market often follows Bitcoin.
MATIC- 1 Hour Chart

Over the past two and a half weeks, MATIC has been trading within a range (yellow) from $1.31 to $1.48, with the mid-point at $1.4. The previous day, MATIC dropped heavily beneath the $1.3 support level as bearish momentum intensified.
But, it was only a ruse to collect liquidity from late sellers, as the price reversed and made its way back above the $1.3 level and within the range. This suggested that the next week could see MATIC rise toward the opposite end of the range.
Forcing these short positions to close or liquidate, followed by a shift in momentum toward bullish, is likely to see MATIC climb to $1.4 and $1.48. On the way there, the $1.43-$1.45 area can act as a solid resistance zone as well.
Rationale
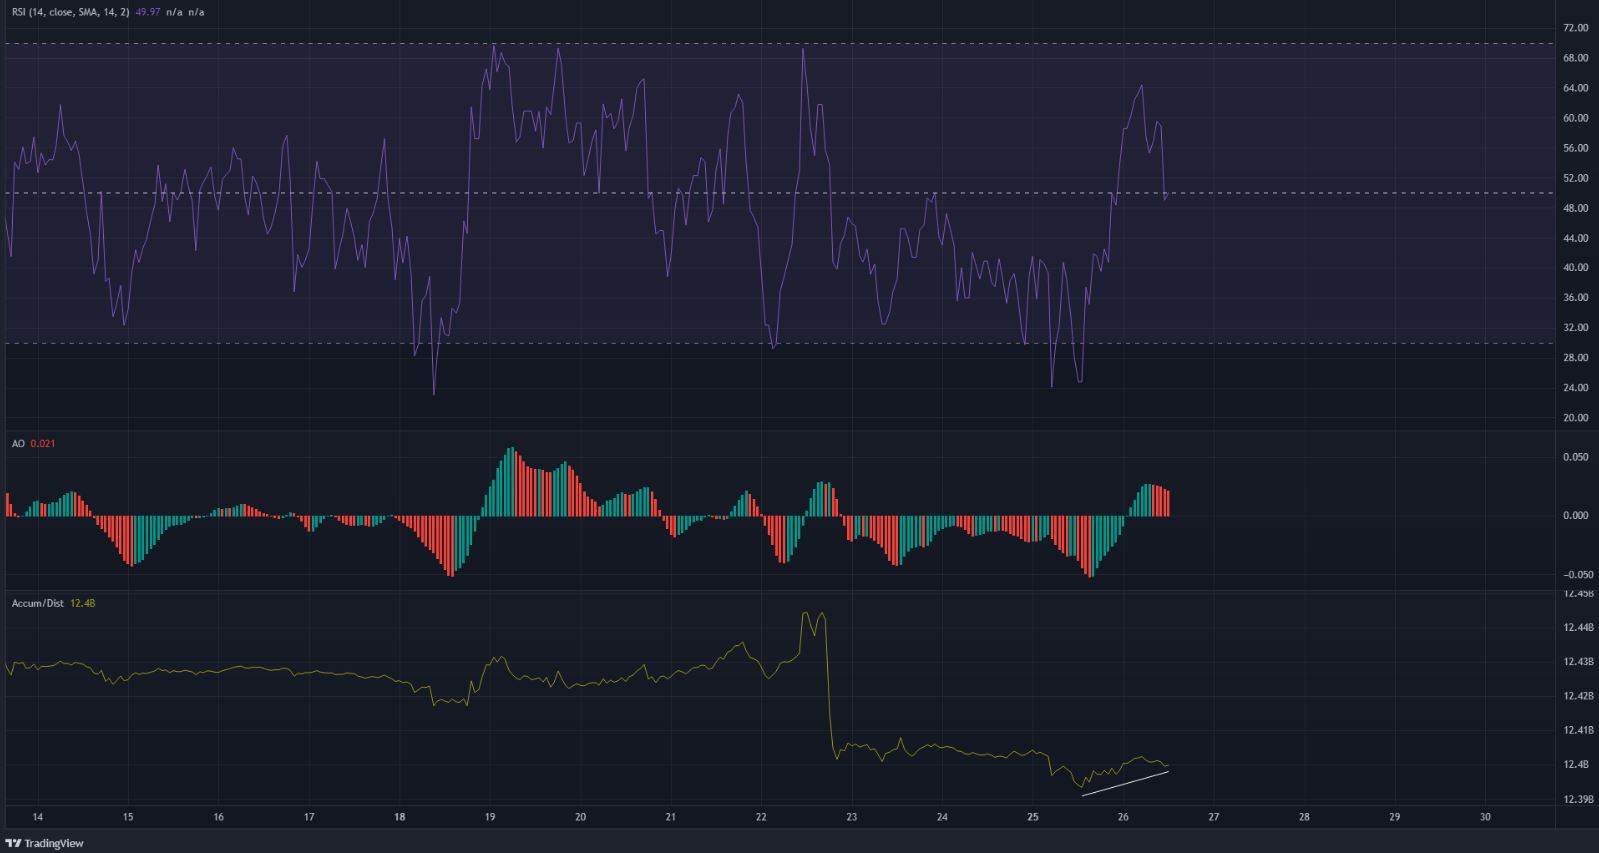
The RSI climbed above the neutral 50 line and appeared to retest it as support at press time. The Awesome Oscillator also climbed above the zero line to show that the downtrend of the past three days has weakened or even ended.
However, the A/R line saw only a weak bounce and overall, it signaled strong selling pressure.
Conclusion
Even though the momentum indicators appeared to turn, there was not yet evidence of strong demand. Despite the lack of demand, it remains likely that MATIC climbs toward the $1.45 and $1.48 area in the next few days, provided Bitcoin stays above the $39.8k area.