MATIC: Counting probability of consolidation in coming week

Disclaimer: The findings of the following analysis are the sole opinions of the writer and should not be considered investment advice.
Polygon [MATIC] has been on a downtrend since late January. The altcoin posted a loss of nearly 80% from April to mid-June, but it saw a near 60% bounce over the past month. Yet, the market structure still remained bearish. There was a chance that MATIC would go on to consolidate underneath a region of heavy resistance.
MATIC- 1-Day Chart
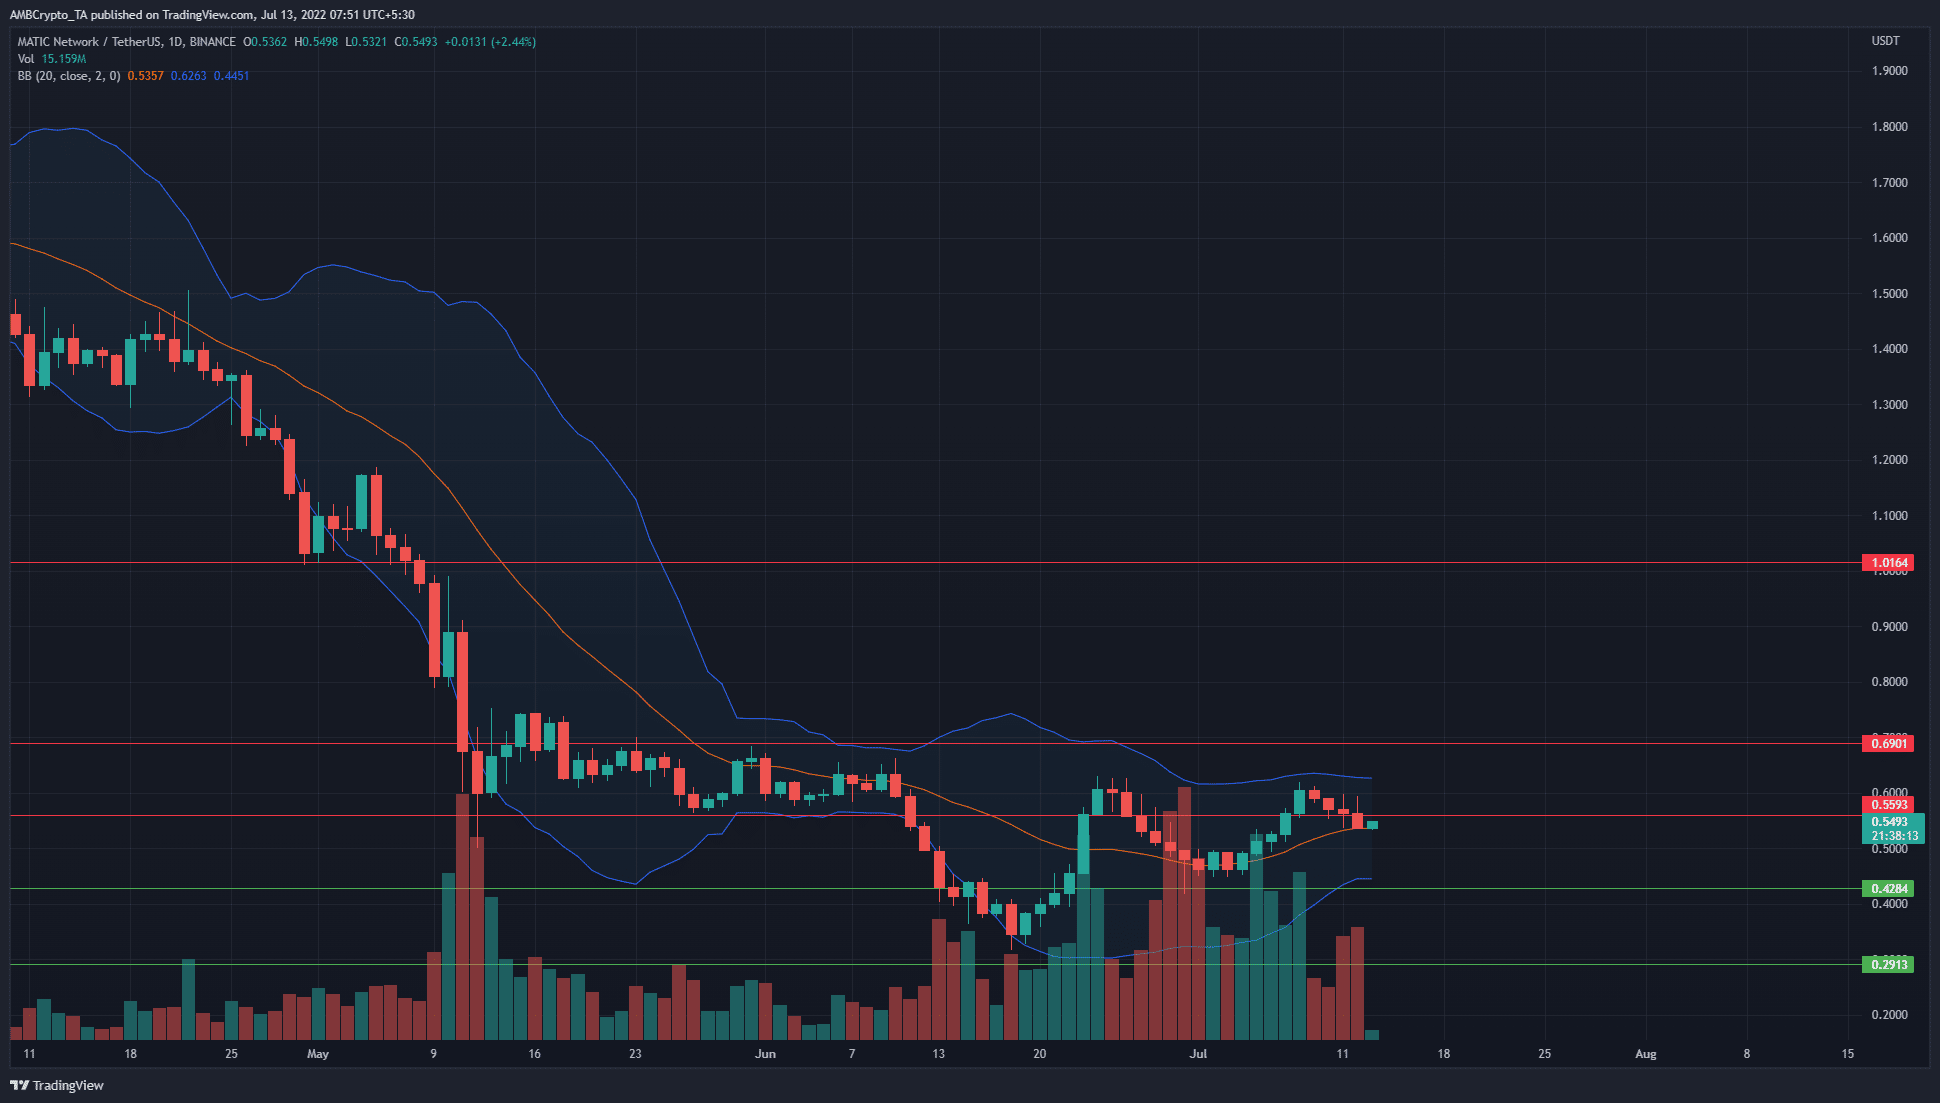
The daily price chart showed an asset in decline as it made a series of lower highs on the chart over the past two months. However, things took a slightly bullish turn over the past month. After a long time, MATIC was finally able to climb past the 20-period SMA on the daily chart.
At the same time, the price also formed a higher low at $0.45. However, the $0.6-$0.7 region offered stiff resistance to MATIC buyers. The token was already in a long-term decline, and the fearful conditions across both the equity and crypto markets in recent months reinforce the bearish bias.
Therefore, the $0.6-$0.7 region would present an opportunity to sell MATIC rather than accumulate it. The Bollinger Bands appeared to tighten around the price as it approached the $0.7 resistance once more.
Rationale
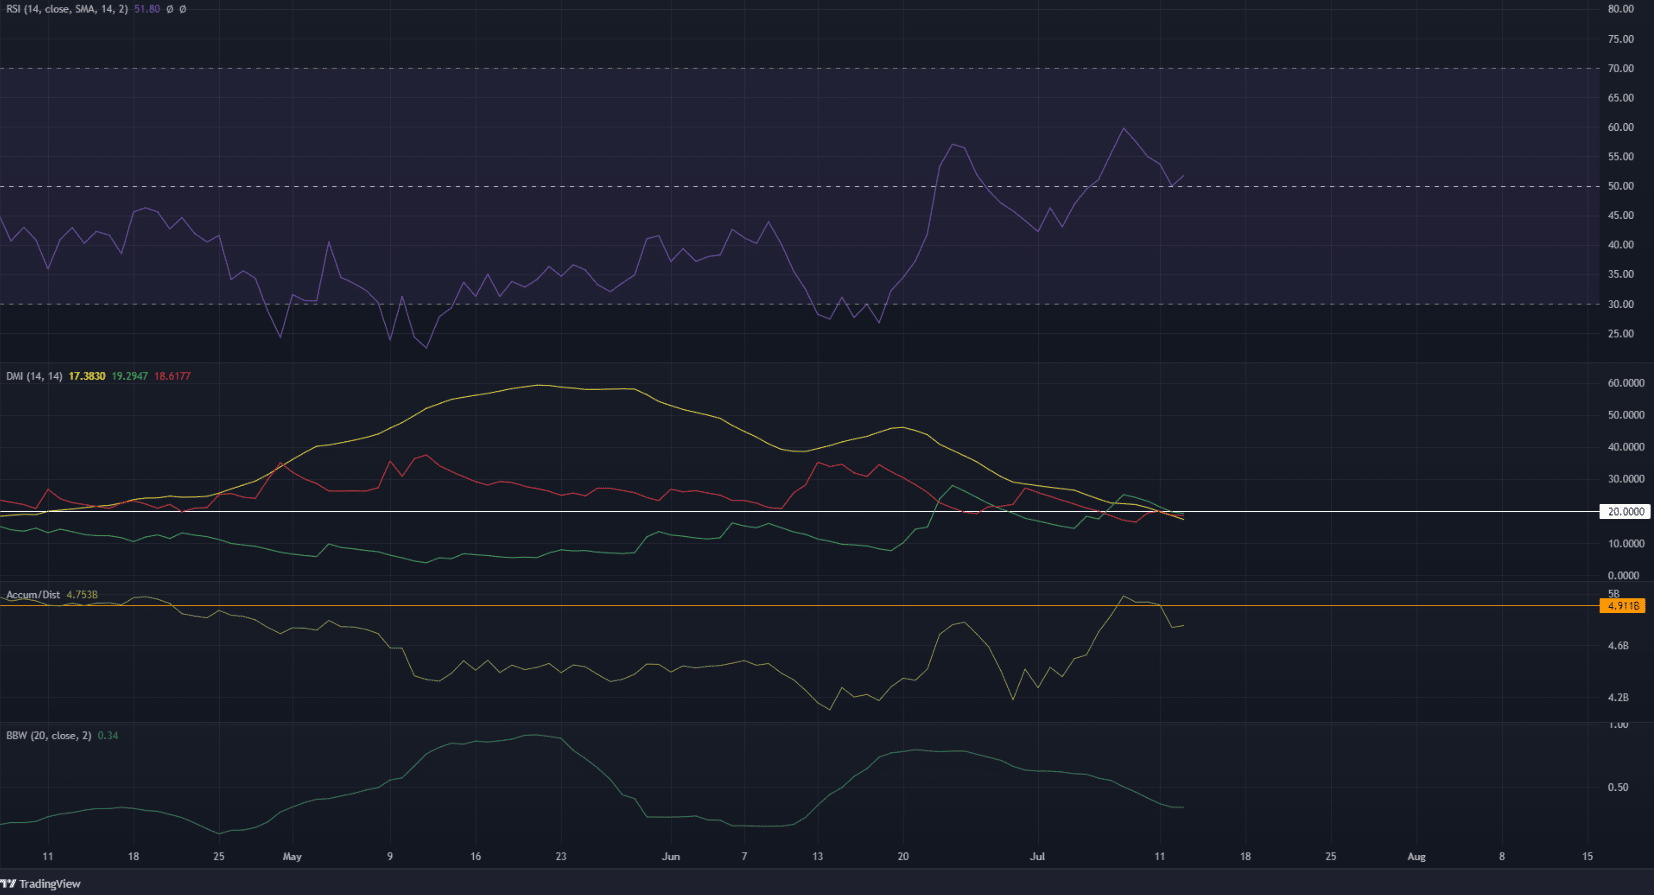
The Relative Strength Index (RSI) gave the bulls some hope as it rose above the neutral 50 level. Moreover, it retested the same as support and could be an early indication of a shift in momentum in favor of the bulls.
The Directional Movement Index (DMI) showed the absence of a strong trend, as the Average Directional Index (ADX) and the +DI and -DI (yellow, green, red respectively) moved beneath the 20 mark.
The A/D line climbed to a resistance level from April but has not yet broken out. The Bollinger Bands width indicator was falling, which suggested a phase of consolidation could be in progress.
Conclusion
Volatility looked to be falling, while momentum swayed very slightly in favor of the buyers. The demand behind the recent rally was significant but not as significant as all the selling pressure over the past six months. Therefore, caution was warranted. Not every 10% move upward was cause to celebrate, as the long-term trend remained bearish.