MATIC finds support at $2, but buying right now might not be the best idea

Disclaimer: The findings of the following analysis are the sole opinions of the writer and shouldn’t be considered investment advice
Polygon saw the price of its native token drop by nearly 16% over the last couple of days, but some demand was seen in the vicinity of the $2-support level. When the price was at $2.42, it looked like MATIC was on a lower timeframe breakout upwards.
Combined with the importance of the $2.42 level in recent weeks, the reaction of the price at $2.42 is a good indication of the sentiment surrounding MATIC. The reaction was bearish and the price was back at a zone of demand.
In other news, Polygon adopted EIP-1559, the network fee burning mechanism that Ethereum introduced in August last year.
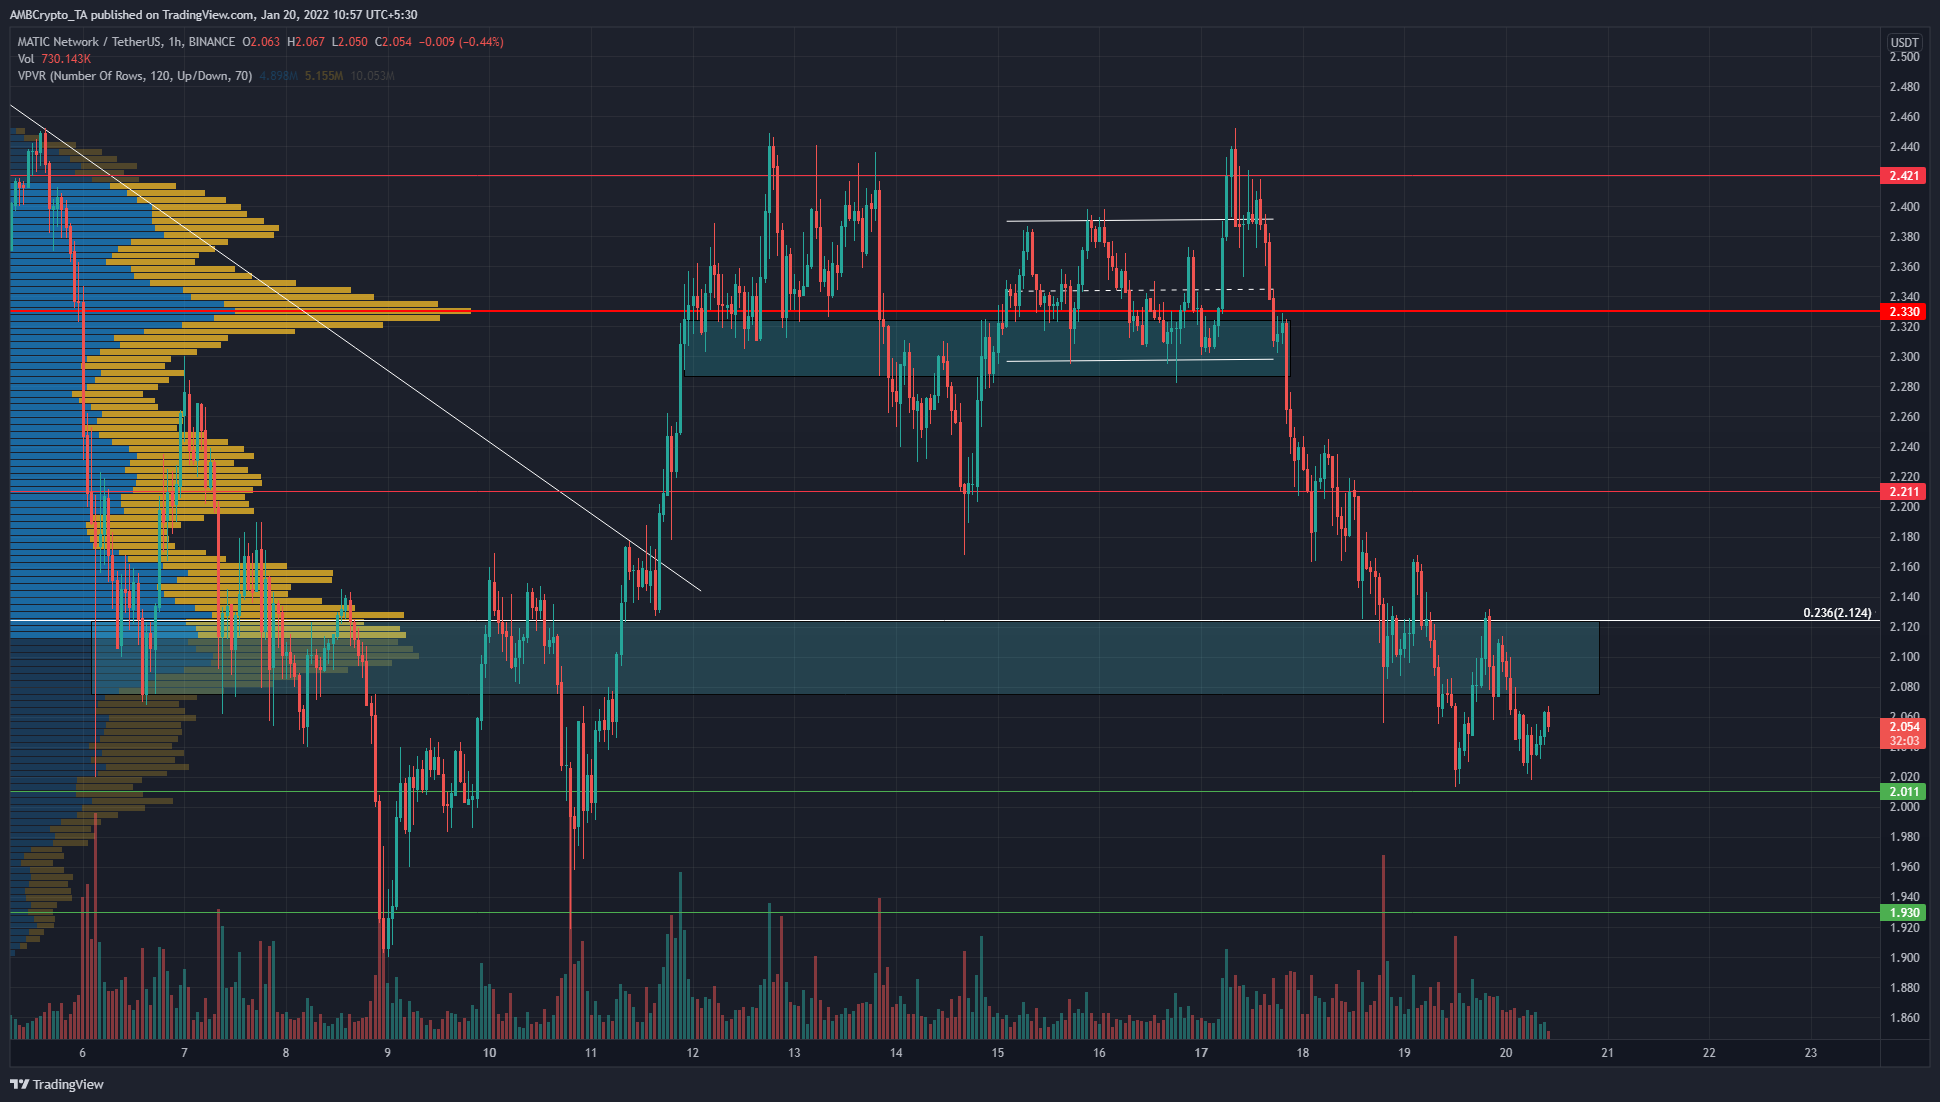
The $2-$2.1 area has served as an area of demand for MATIC in the past. In a similar fashion, rejection at the $2.12-level has seen MATIC dive toward $2 and $1.93 in search of demand. At the time of writing, MATIC had already been rejected at $2.12 the previous day.
Yet, the price formed a (marginally) higher low on the hourly chart. This might lead to the price forming a triangle pattern of lower highs and higher lows just beneath the $2.12-level. Such a pattern would represent compression.
Regardless of the pattern that evolves in the next few hours, $2.12 remains a significant resistance level. A flip of this level back to support would be necessary for MATIC to climb higher. Another rejection could see $2 and $1.93 tested shortly.
Rationale

The momentum indicators showed that bearish momentum was waning. Both the Awesome Oscillator and the MACD formed a series of higher lows over the past couple of days. This came alongside the price seeing lower lows to test $2.01, which meant a bullish divergence had developed.
The price was trading beneath the Value Area Lows at $2.12. This area was also a high volume node, meaning it was likely to pose strong resistance to price movement. Subsequently, MATIC bounced to test $2.12 as resistance, and a bearish order block was seen on the hourly chart.
Conclusion
The formation of a bearish order block under a crucial resistance level marked the area where bears had posted their sell orders, the place on the chart where they have constructed their ramparts. At the time of writing, the bulls weren’t strong enough to scale these yet.
Price always seeks liquidity, and this can likely be found in greater quantity at $1.93. Hence, a brief, false foray above $2.12 to trick late longs before a drop to $1.93 could be the path forward for MATIC in the next couple of days.