MATIC is poised for a rally but the long-term technical bias favors sellers

Disclaimer: The findings of the following analysis are the sole opinions of the writer and should not be considered investment advice.
- The higher timeframe structure flipped to bearish last month
- Selling pressure is slightly more dominant since August
Polygon has recorded a massive rise in the number of dApps on the platform since the start of 2022. It also announced a partnership with a Web3 studio. In the past ten days, the $7.2 billion market cap asset has managed a sharp bounce from the $0.72 support zone.
Here’s AMBCrypto’s Price Prediction for Polygon [MATIC] for 2022-2023
However, a look at its higher timeframe price charts showed bearish signs in the past two months. Can MATIC manage to break out of its four-month range?
Look to sell a rally to $1 rather than anticipate a breakout
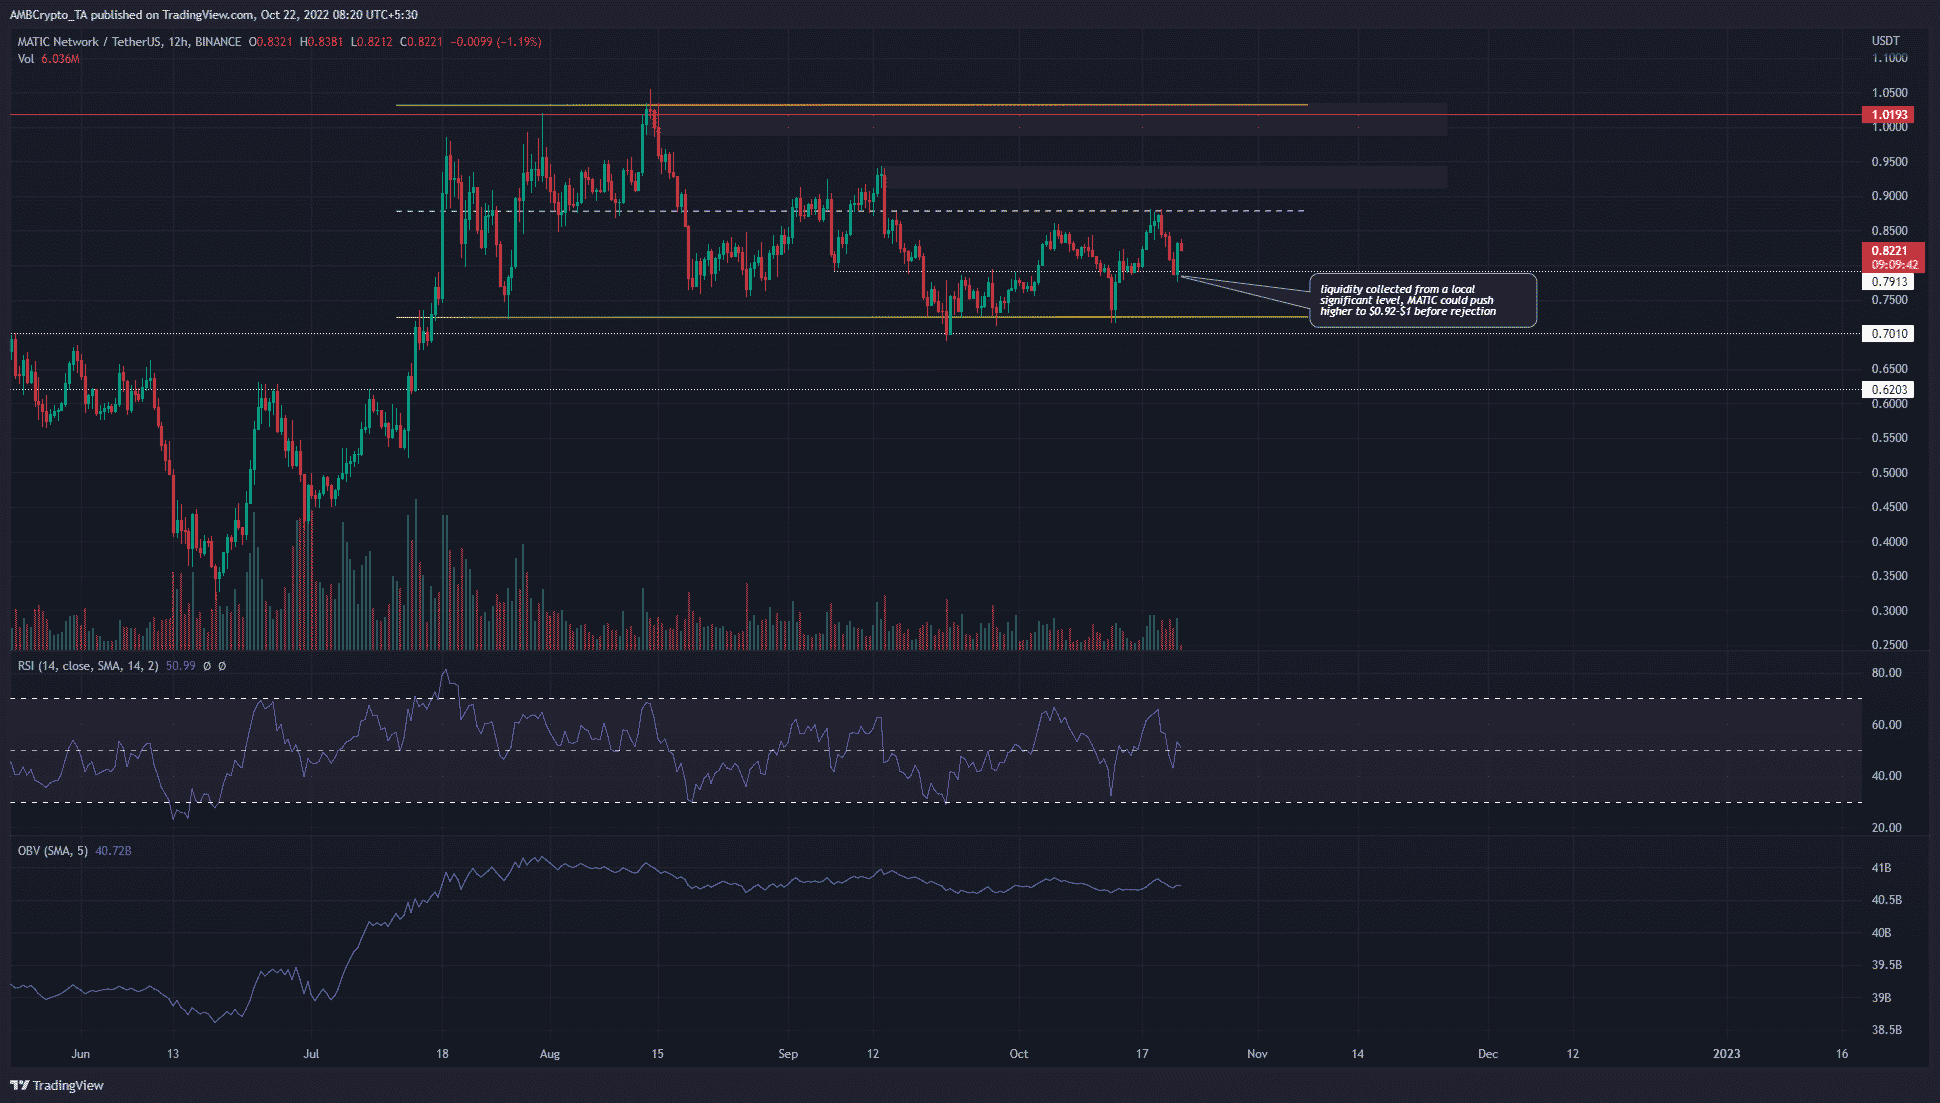
A look at the three-day chart (higher timeframe) showed that the move to $0.7 in mid-September broke the market structure to bearish. It has stayed that way since. Hence, higher timeframe traders can look to sell MATIC and thus trade with the trend.
An interesting development over the past ten days was MATIC’s swift drop to $0.715 and, later, the $0.775 levels before a bounce. This suggested that the price collected liquidity from those significant areas and was likely to push higher at the time of writing.
To the north, two bearish order blocks at $0.92 and $1 were present, with the $1 block being more significant. The $1 psychological level also marked the high of the range (yellow) from $0.72.
The Relative Strength Index (RSI) on the 12-hour chart showed the lack of a strong trend over the past month. At press time, it had managed to defend neutral 50 and could bounce higher to signal some upward momentum. On the other hand, the On-Balance Volume (OBV) very slowly formed a series of lower highs since mid-August. This suggested sellers had a slight advantage in recent months.
Exchange supply dwindles to signal accumulation
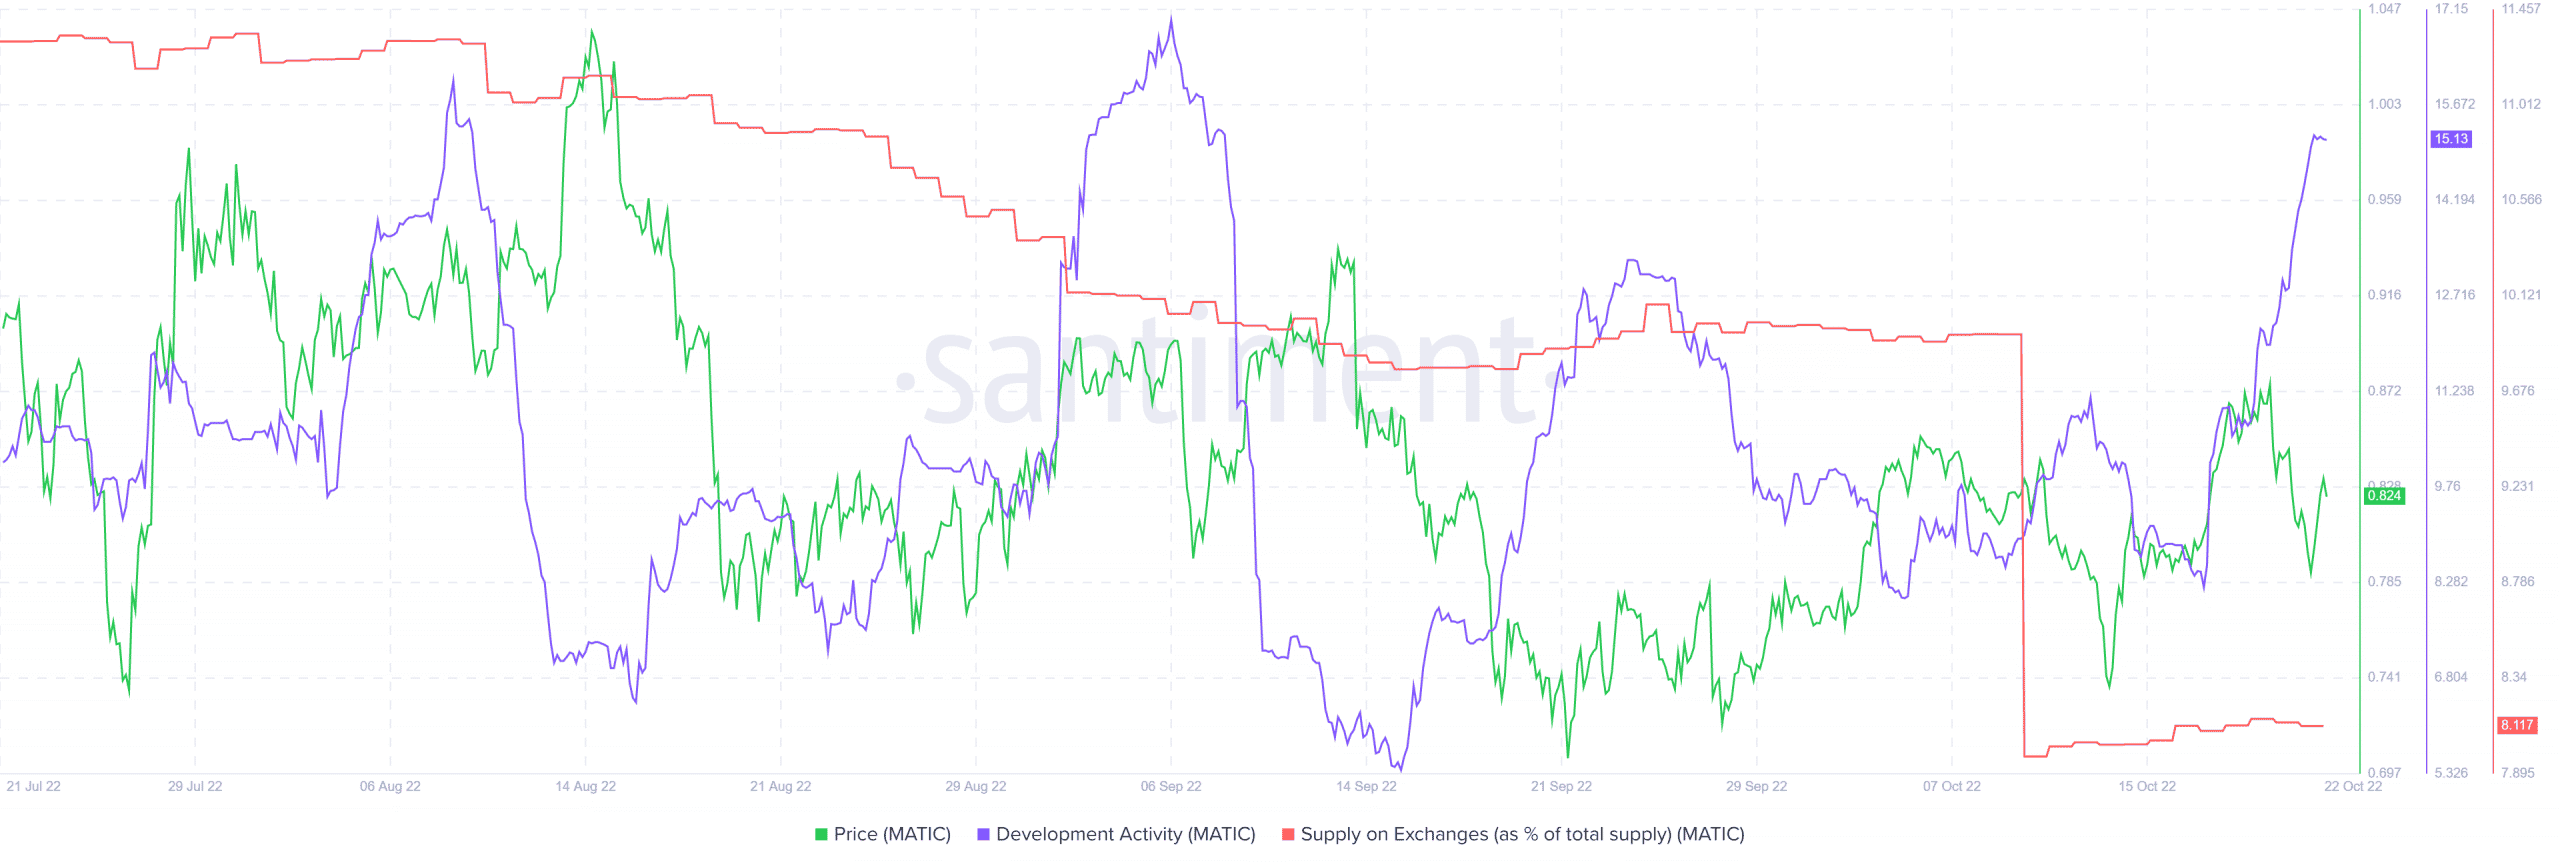
On the metrics front, the development activity witnessed a healthy uptrend in October. Although this metric does not correlate well with the price movement, long-term investors can be emboldened by the developers’ continuous work.
The supply on exchanges percentage has been in a downtrend since mid-June. This was when MATIC traded near the $0.4 mark. Moreover, this metric began to see a sharp uptick from January to June this year, when MATIC went from $2.58 to $0.37. Therefore, the downtrend of this metric suggested that long-term investors were likely buying the asset slowly over time.