MATIC: This area could be tested before a move toward $0.92

Disclaimer: The findings of the following analysis are the sole opinions of the writer and should not be considered investment advice.
In the twelve hours of trading that preceded press time, Bitcoin [BTC] saw a bounce from the $19.6k support zone to trade at $20.1k at press time.
This move helped MATIC climb past the $0.85 resistance level. The native token of Polygon has already tested the demand zone at $0.76. Further buying pressure could see the asset climb toward $0.92 and even as high as $1.
MATIC- 1-Hour Chart
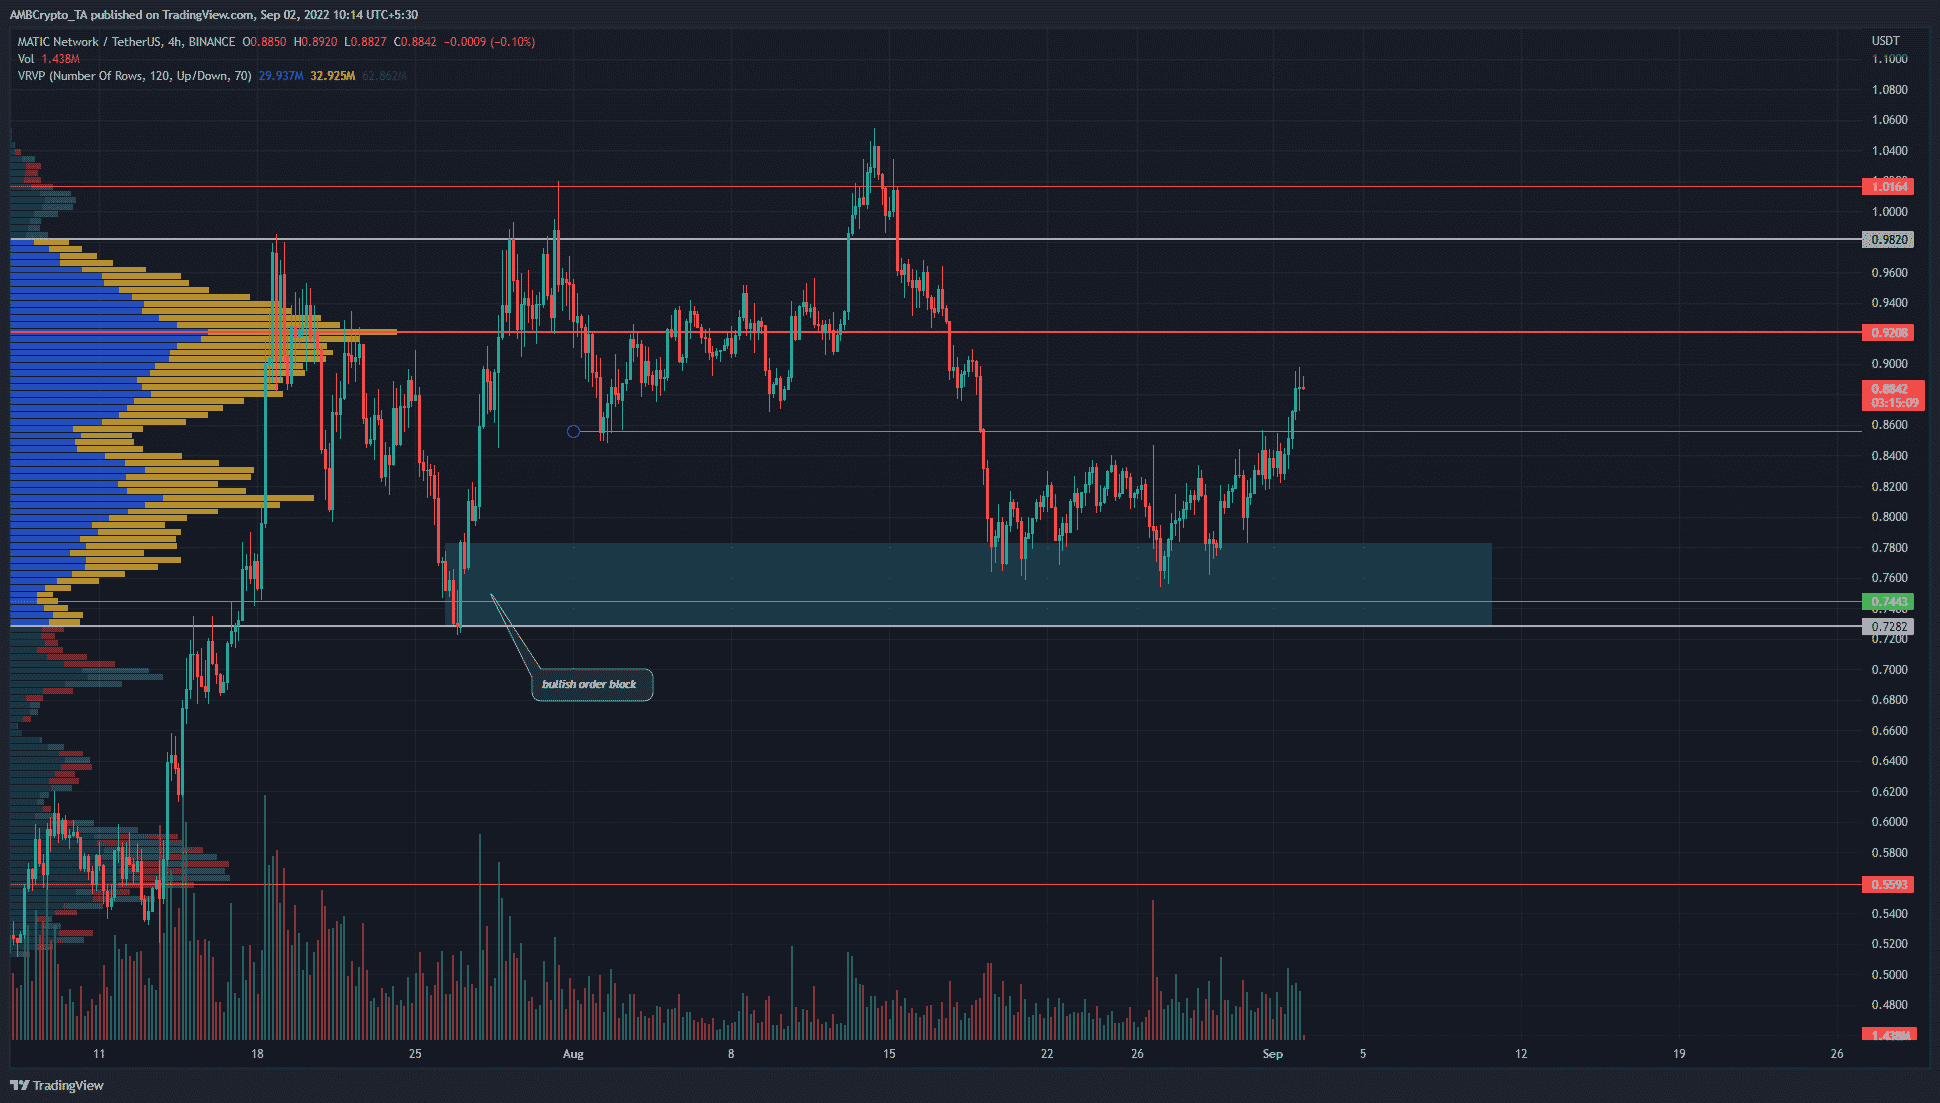
The four-hour chart showed MATIC establish a range from $0.76 to $0.82 over the past couple of weeks. The birth of September saw MATIC push past the range highs, and past the $0.85 resistance level as well.
At press time, the token exchanged hands at a price of $0.884. While the short-term outlook remained bullish, there was some liquidity to the south that MATIC could dip to capture.
The Volume Profile Visible Range tool showed the Value Area Low and High to lie at $0.728 and $0.98 respectively. The Point of Control was at $0.92.
On the volume bars, it can be seen that the past three weeks of trading did not see much volume traded at the $0.84-$0.85 zone.
This area could be briefly tested before a move higher toward $0.92. The bullish order block at $0.76 can also act as support, in case MATIC drops below $0.85 and $0.82.
Rationale
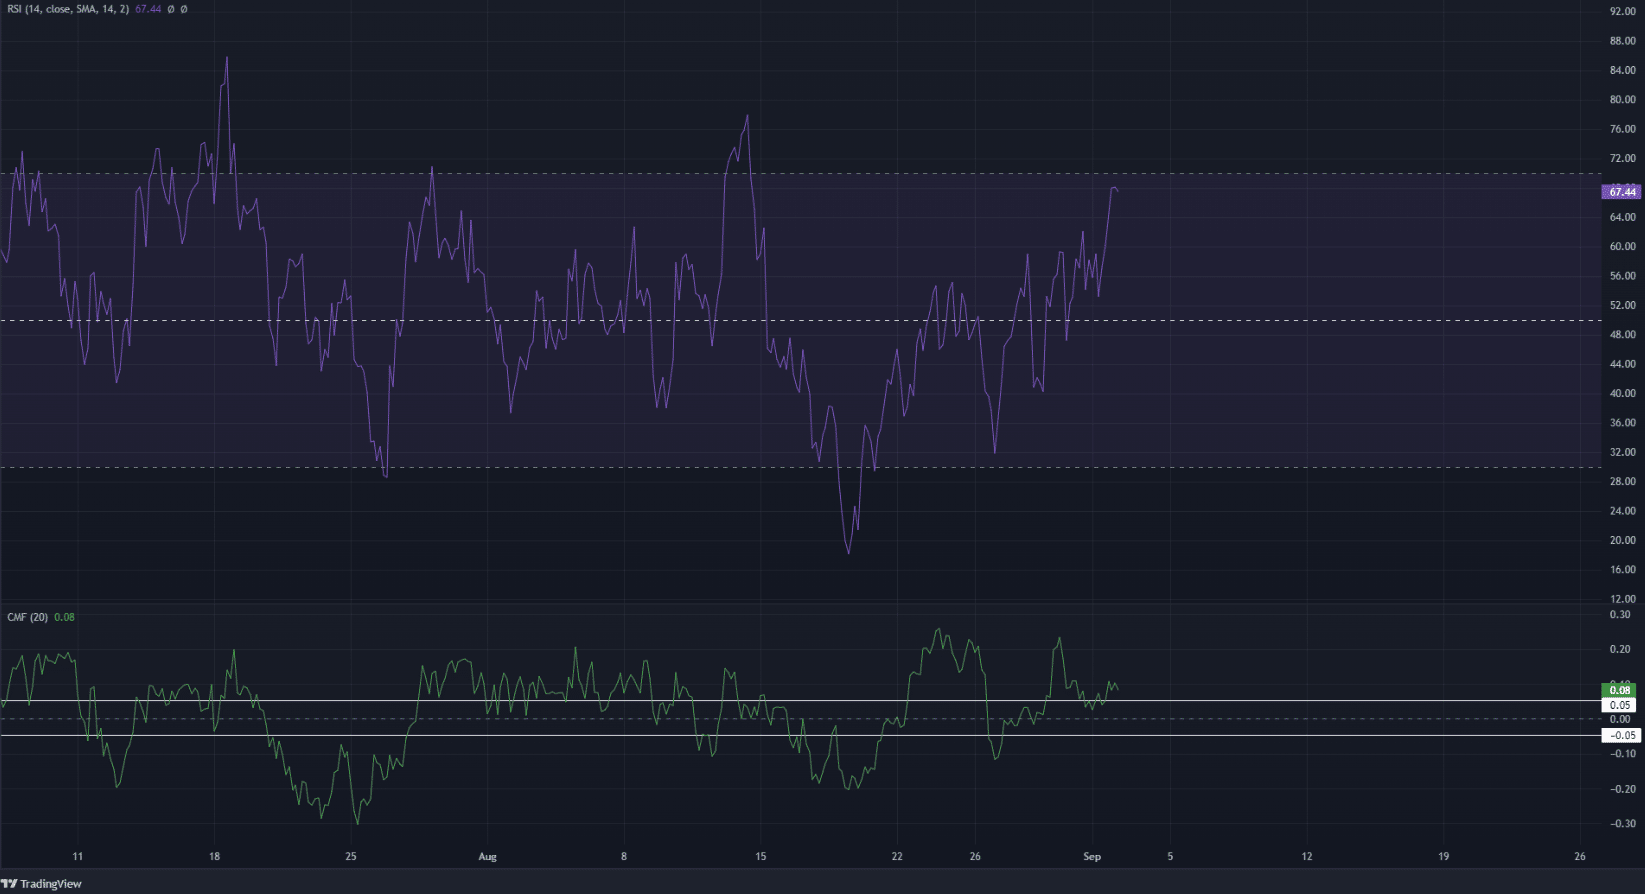
The four-hour Relative Strength Index (RSI) was at 67 to show strong bullish momentum. In the event of a pullback, the neutral 50 and the 60 value mark can act as support. Tests of these levels on the RSI can be used to slowly scale into a short-term long position.
The Chaikin Money Flow (CMF) also climbed past the +0.05 mark over the past few days. This hinted at strong capital flow into the MATIC market and was a sign of good buying strength behind the rally from $0.76.
Conclusion
The price action of MATIC in recent weeks showed that the $0.88-$0.9 area posed significant resistance. The VPVR tool suggested that a move toward $0.85 and $0.84 could be a buying opportunity, with support at the $0.82 level as well. The indicators also showed bullish momentum and buying pressure.
If Bitcoin can remain above the $19.2k-$19.6k area in the next few days, MATIC might be able to run to $0.92 and possibly even as high as the Value Area High (VAH) at $0.98.


