MATIC: This is key to flipping the bearish market structure

Disclaimer: The findings of the following analysis are the sole opinions of the writer and should not be considered investment advice
The Polygon chain has hit some bumps on the road over the past few months. The “critical network vulnerability” that cropped up in December was subsequently fixed, and the Total Value Locked on the chain has seen quick hikes in recent weeks.
Even as the number of dApps grew, social sentiment continued to wane. The sentiment of market participants also seemed to be subdued and MATIC was in a phase of consolidation before its next major move.
MATIC- 1D
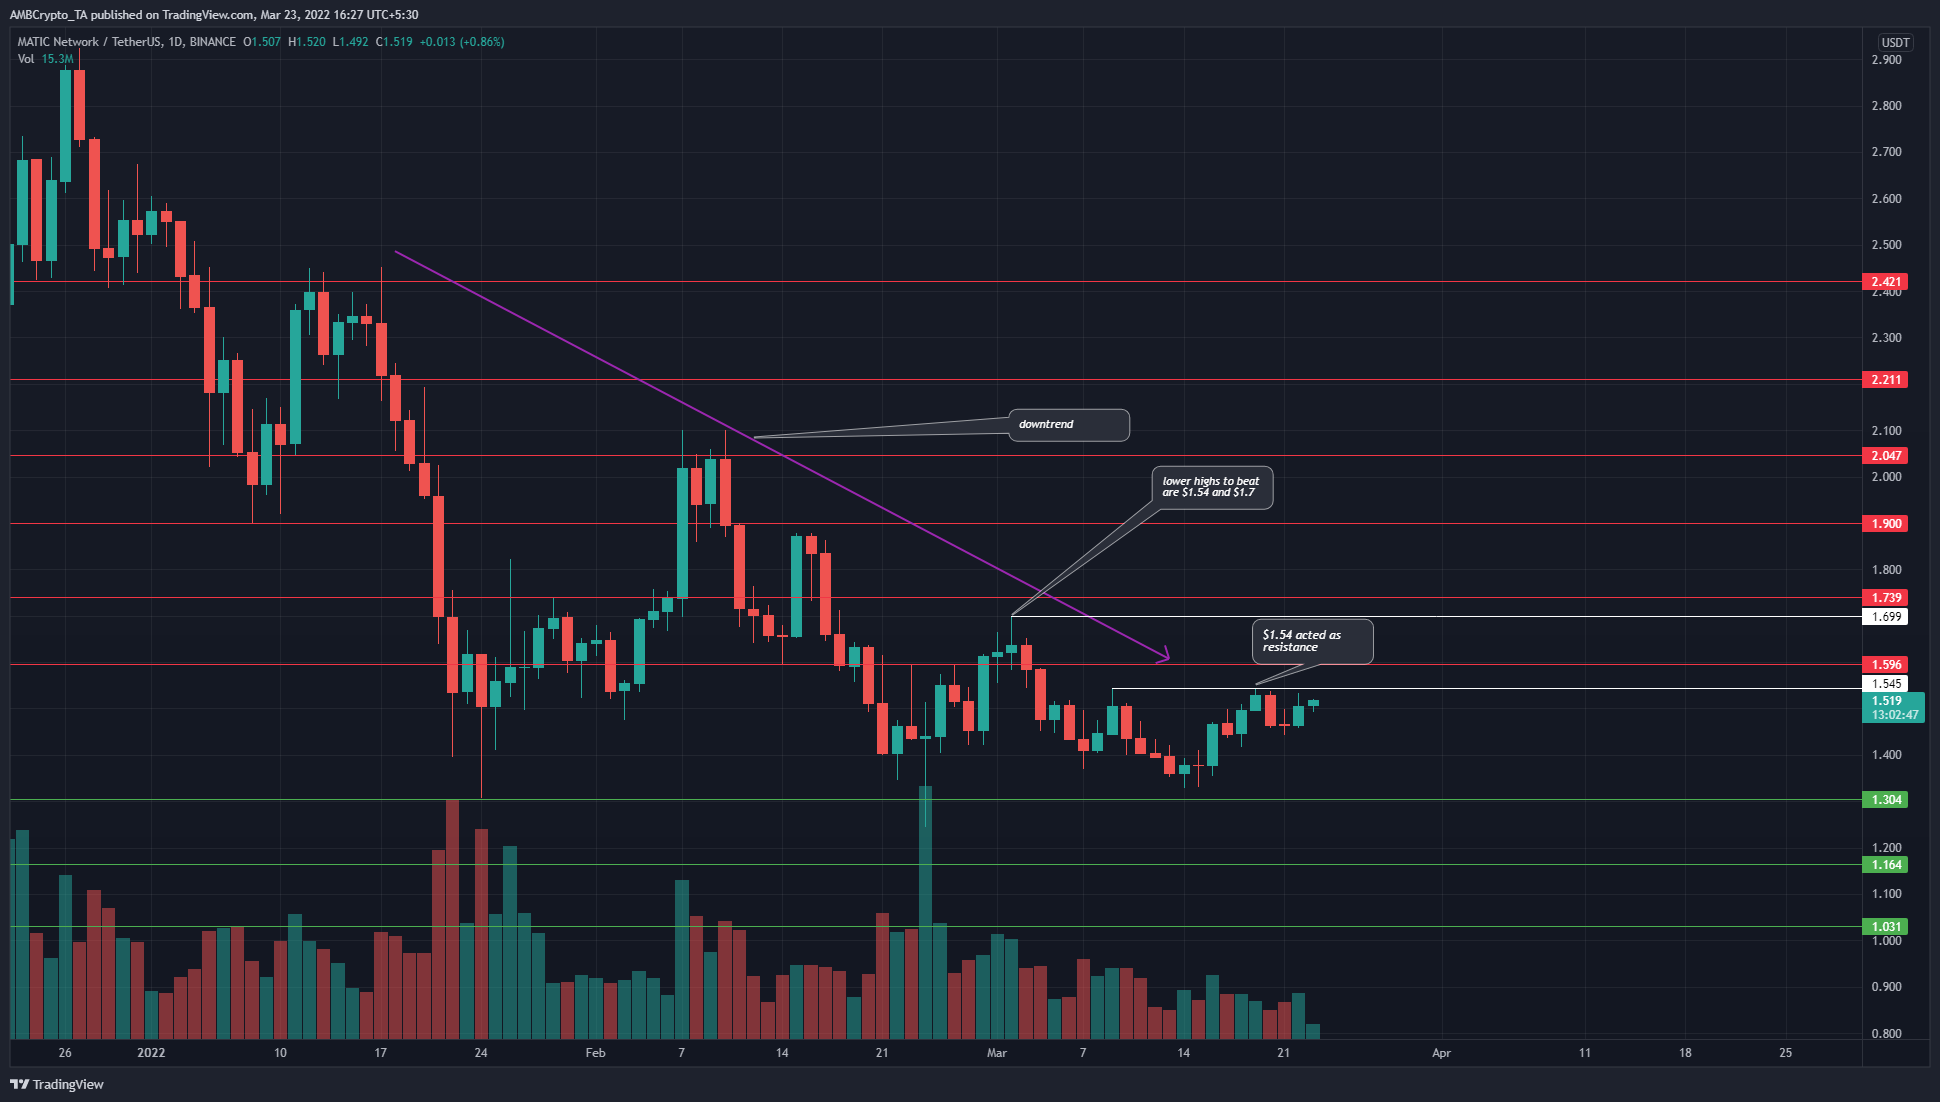
MATIC has been on a downtrend since early January when the $2.42-level failed to hold as support and was retested as resistance a couple of weeks later. At the time of writing, the price had strong support in the $1.36 area, but it also faced stiff resistance levels at the $1.545 and $1.7-levels.
These are the levels that are the recent lower highs of the downtrend. And, in order to flip the longer-term market structure, the price would need to break above these levels.
The entire area from $1.3-$1.42 has seen demand step in and halt the advance of the bears. But, how much longer will it be before buyers run out of ammunition and are exhausted? Therefore, rather than looking to buy a retest of the $1.35-area, it could be more beneficial to wait for a break in market structure before looking for buying opportunities.
On the other hand, a rejection at the $1.54-area could be followed by a move towards $1.3 and possibly, further lower.
Rationale
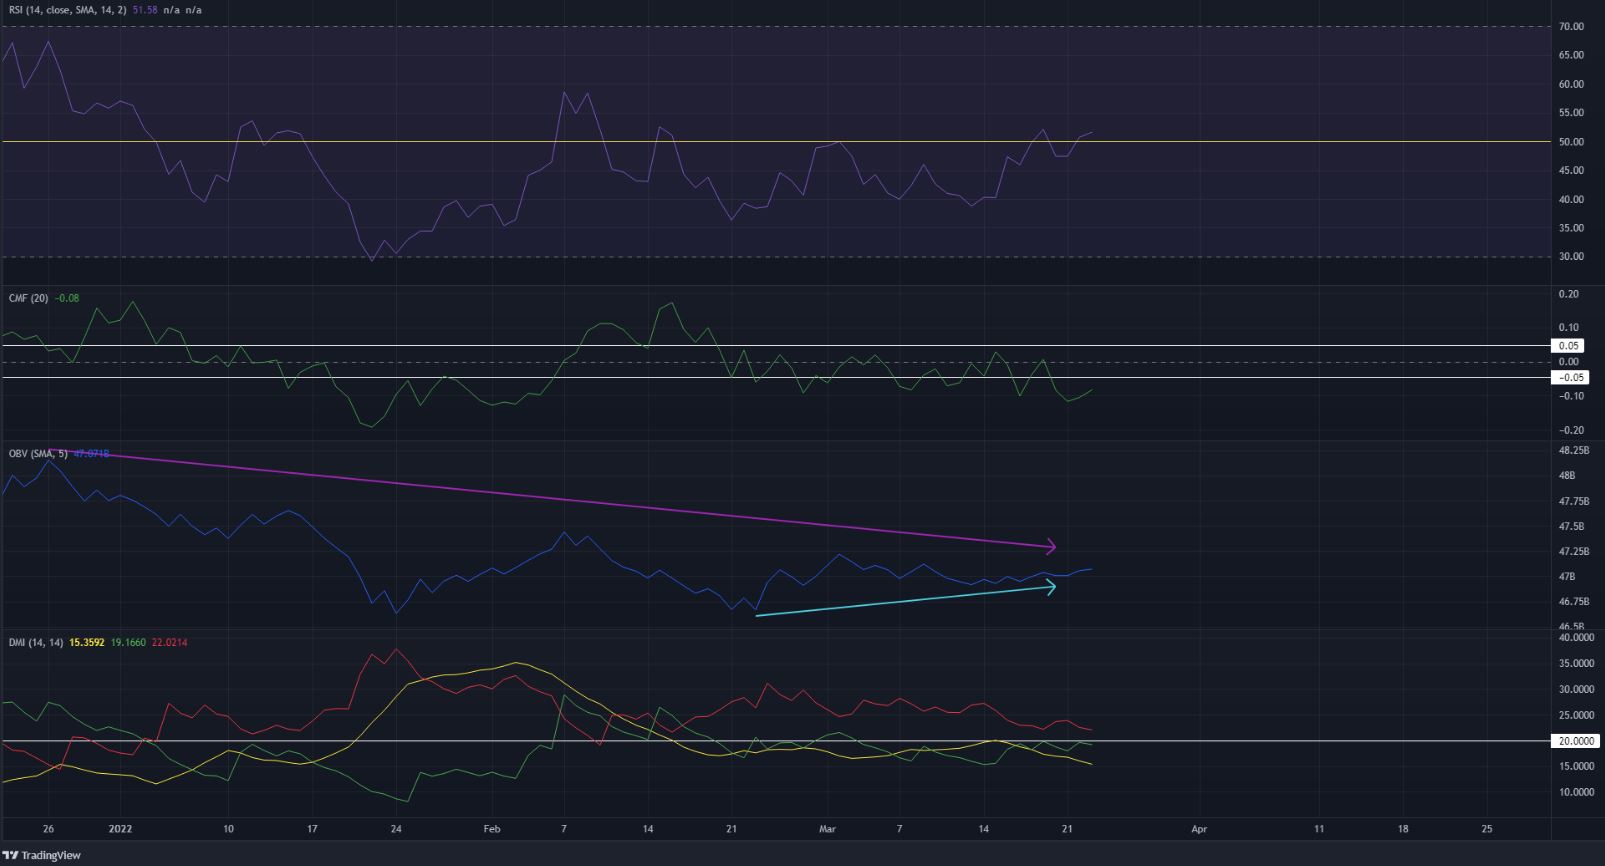
The RSI has been under the neutral 50 line for the past three months, with brief forays above 50 that were rebuffed quickly. The CMF was below -0.05 to show significant capital flows out of the market. This was slightly at odds with the OBV. Although the predominant trend of the OBV was southbound, it has registered higher lows in the past month. This suggested the presence of weak demand.
The DMI did not show a strong trend in either direction – A sign that the market could be consolidating.
Conclusion
The bearish and bullish scenarios for MATIC are as follows – The bulls would look for the $1.545 and $1.7 levels to be broken, while the aggressive bears could look to short a test of these levels.
To the south, the $1.3-$1.4 area could offer support.


