MATIC’s latest price action could put short-term holders at a risk. Here’s why…

Disclaimer: The information presented does not constitute financial, investment, trading, or other types of advice and is solely the writer’s opinion
- MATIC’s current short-term trading range may persist unless BTC changes direction
- Analysts held a bearish stance on the asset as trading volumes declined
Polygon [MATIC] has traded sideways since the late hours of 14 January. Bitcoin’s [BTC] bullish momentum eased into the weekend, cooling off the rally witnessed by altcoins in the past few days.
BTC’s short-term market structure was in a trading range of $20.14K – $21.41K. Most of the altcoins followed suit, forming their respective short-term trading range.
At press time, MATIC was trading at $0.976 and could continue to oscillate within this range in the next few hours/days.
Read Polygon’s [MATIC] Price Prediction 2023-24
Is MATIC read to switch sides?

The recent bull rally saw MATIC form a rising channel (white) on the four-hour chart. MATIC traded sideways within the $0.9701 – $1.0076 range, and the structure fell between the 78.6% and 61.8% Fib levels.
The Relative Strength Index (RSI) retreated from the overbought zone while the On Balance Volume (OBV) declined and moved sideways. This showed that buying pressure fell, but the fluctuating trading volumes could further set MATIC for an additional stay in its sideways structure.
Thus, MATIC could oscillate between $0.9701 – $1.0076 in the next few hours/days or break below it to the 50% Fib level of $0.9437 if trading volumes fell sharply.
How much is 1, 10, 100 MATICs worth today?
However, a break above $1.0076 would nullify the above neutral bias. Such a move could happen if BTC’s bullish momentum increased and pushed it above its current range. The upside swing could see MATIC retest the overhead resistance at $1.0554.
MATIC’s trading volumes and investor confidence declined
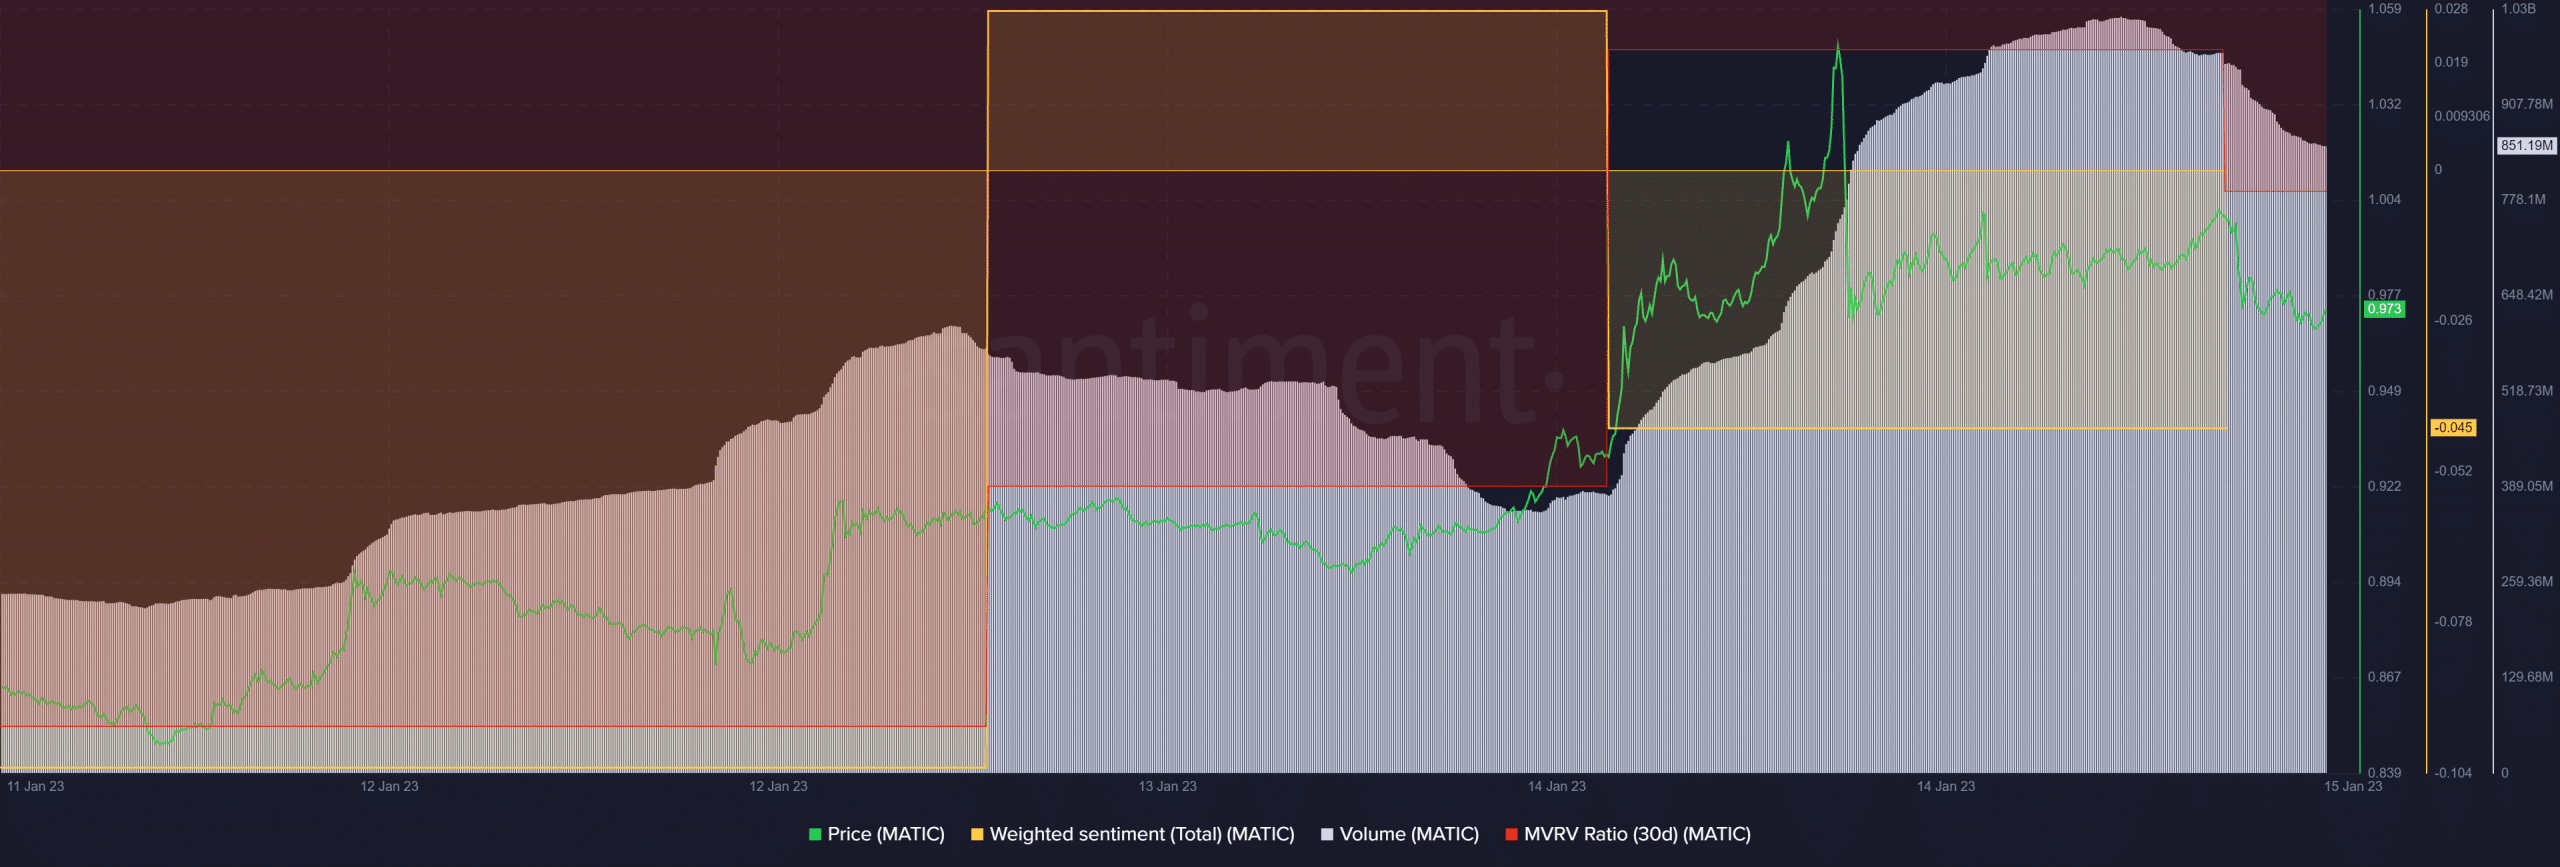
According to Santiment, MATIC’s trading volumes peaked on Saturday (14 January) before taking a U-turn. At the time of publication, the trading volumes had dropped from about 1 billion to around 850 million as prices fell lower.
The recent price drop discarded short-term HODLers’ hope of turning a profit. The 30-day market value to realized value (MVRV) had retreated from the deeper negative zone only to slide slightly deeper into the zone after failing to cross the neutral line. This showed that short-term MATIC HODLers saw reduced losses but could be exposed to more losses in the short term.
In addition, MATIC’s weighted sentiment turned negative as the price peaked on 14 January. This indicated analysts’ bearish outlook and could lower MATIC’s prices if it persists.


