Monero, SUSHI, Uniswap Price Analysis: 16 June

For most coins, the prevailing market trend is an opportunity for gains, while for others it’s a correction phase as the total market capitalization fell by 2.1% to $1.635 trillion.
Monero was in the limelight recently for becoming a preferred ransom for cyberware attacks. SUSHI lost 5.4% of its market capitalization while Uniswap V3’s protected source code being copied by anonymous developers to create a fork called HolaSwap, were the other highlights this week.
Monero [XMR]

Source: XMR/USD – TradingView
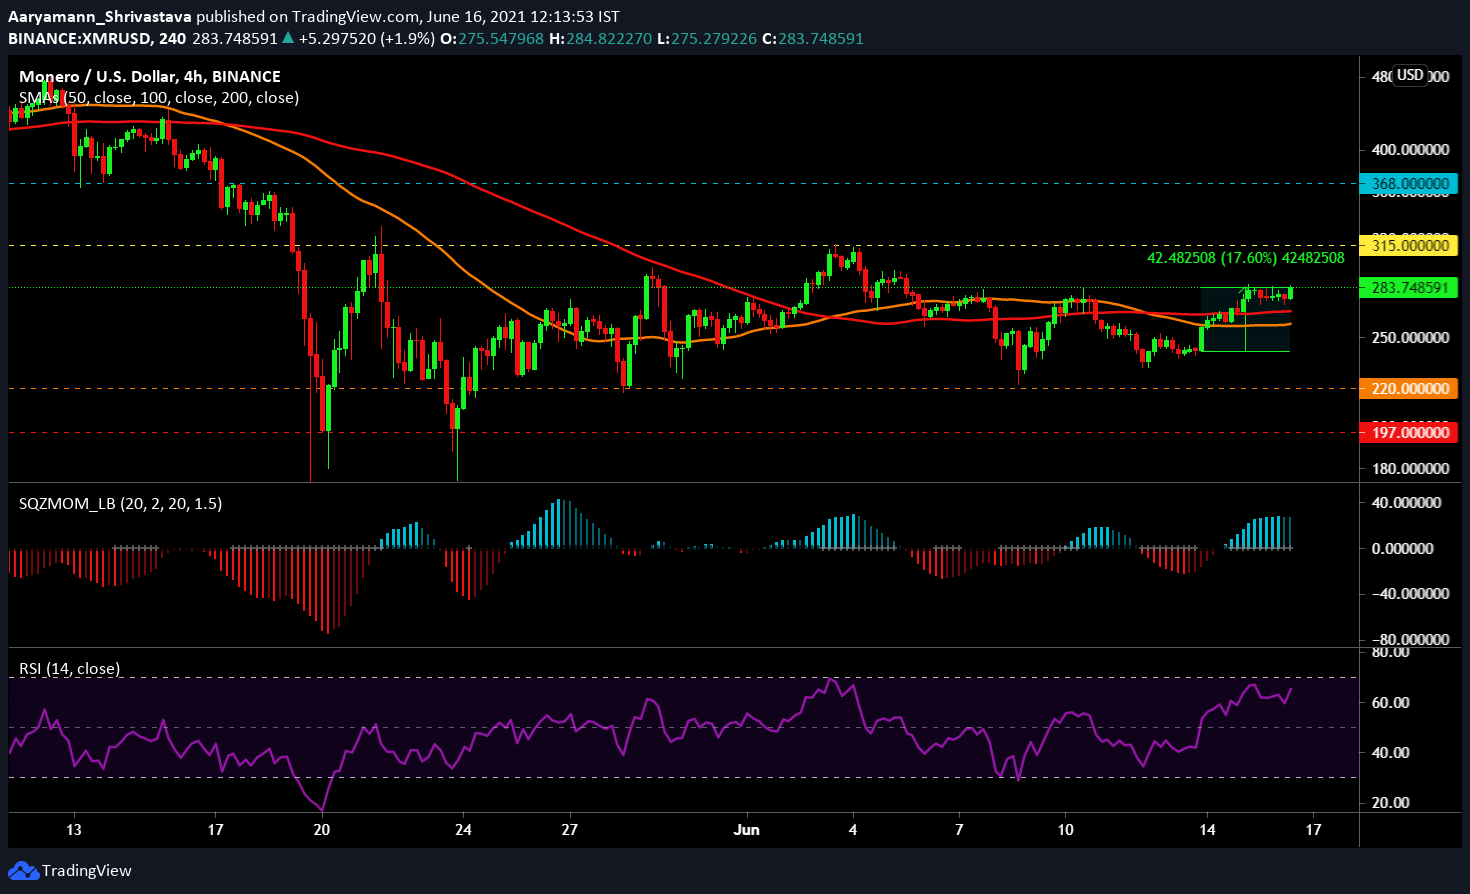
Monero has been pushing up towards its $315-resistance level. The coin has had a 17.6% hike in the last 2 days, bringing the coin to $283. According to the Squeeze Momentum Indicator, the coin appeared to be in an active squeeze release due to the presence of white dots at press time. Bullish pressure could be observed receding, however.
Both Simple Moving Averages lines – 50 SMA (orange) and 100 SMA (red) – were strongly bullish, resting under the candlesticks. On the Relative Strength Index (RSI), the purple line indicated a slight uptick, with the same climbing towards the overbought zone.
Based on the indicators, the coin could see a slight price fall, but the same would merely be a market correction.
SUSHI

Source: SUSHI/USD – TradingView
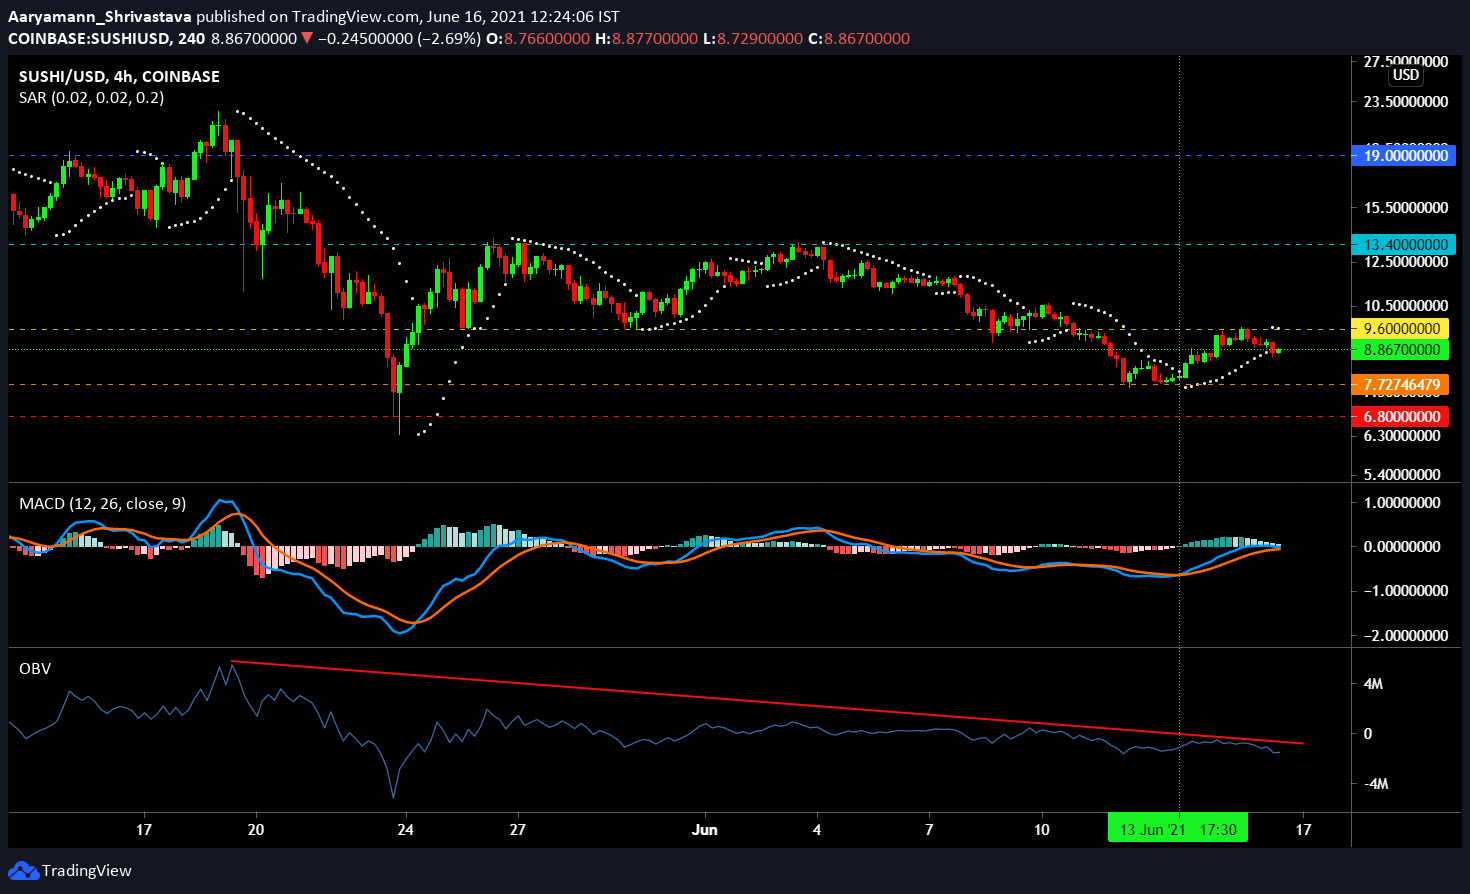
SUSHI maintained $9.6 as strong support for a long time, until the June 8 dip flipped it into a resistance level, creating a critical support level at $7.2. In the last 24 hours, the coin unsuccessfully tried to flip $9.6 back into support and traded at $8.8 at press time. The MACD indicator noted a bullish crossover on June 13. However, at the time of writing, the blue indicator line and the red signal line remained aligned at the neutral line.
On Balance Volume (OBV) displayed continued selling in the market as the indicator continued to fall under the 0 mark. At the time of writing, the Parabolic SAR pictured an active downtrend with the white dots appearing above the candlesticks.
For the coin to go past the resistance level, the coin will need stronger momentum. However, broader market cues pointed to a price fall in the near term.
Uniswap [UNI]

Source: UNI/USD – TradingView
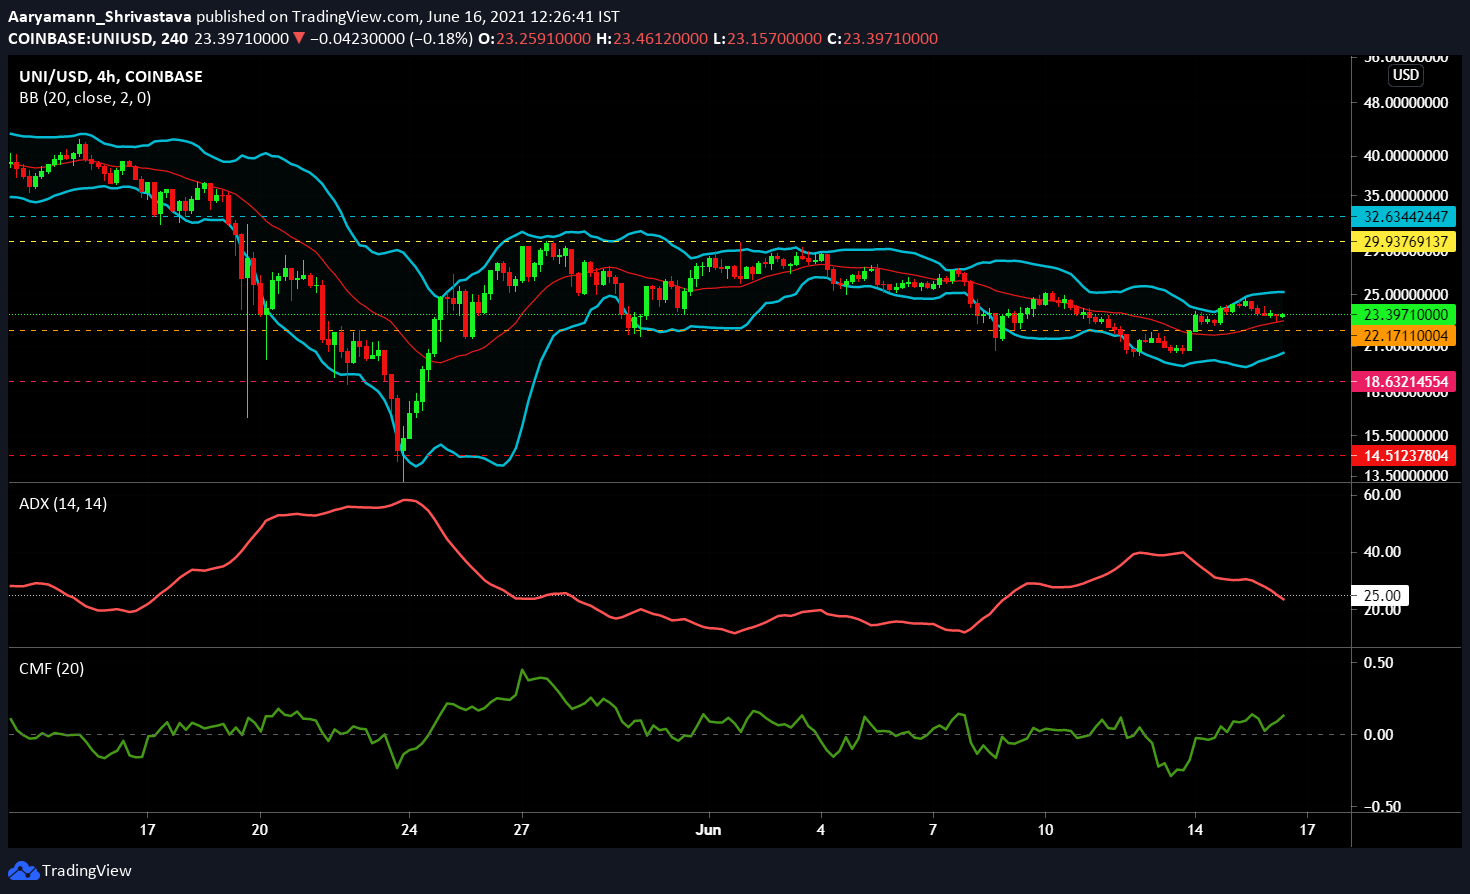
During the June 13 trade, UNI managed to flip $22.1 back into a support level, trading at $23.3 at press time. The coin continued to move sideways, registering lower highs on the 4-hour chart. The Chaikin Money Flow saw capital inflows building up as the indicator noted a slight uptick.
The Bollinger Bands moved slightly upwards while remaining parallel and the basis acting as a support at the time of writing. The falling Average Directional Index (ADX) pointed to a weak active trend too. This could bring some stability to the coin’s movement going forward.
$22.1 remains a critical support level and falling through it would bring $18.6 as the support level for UNI.


