Monero, Waves, Compound Price Analysis: 30 March

Monero showed weakness as it attempted to flip the $239.05-resistance level. Waves settled between $12.5 -$11.5, while a hike above its press-time resistance would see Compound move closer towards the $447.4-mark.
Monero [XMR]

On the 4-hour timeframe, Monero noted bullish movement as the price closed in on the $239.05-resistance. However, the overhead resistance has rejected the price on multiple occasions in March already, and this could likely be the outcome once again. The Signal line moved closer to the MACD line and a bearish crossover would keep the price restricted below $239. The Awesome Oscillator registered a series of red bars and showed that momentum rested with the sellers, at the time of writing.
On the other hand, a spike in the 24-hour trading volumes could signal a favorable outcome. The next level of resistance can be found at the $260-mark.
Waves [WAVES]

The Bollinger Bands on Waves showed that the volatility was settling down in the market after some bullish movement during the past week. Gains over the last seven days amounted to over 22% as the price transitioned away from a rangebound channel. However, lower volatility pointed towards another period of consolidation between $12.5 -$11.5.
While the Awesome Oscillator showed positive momentum, a hike above the press time channel looked unlikely. If the upper ceiling is breached, the next barrier would lay at $13.1 – a level that was last seen prior to the late-February pullback.
Compound [COMP]
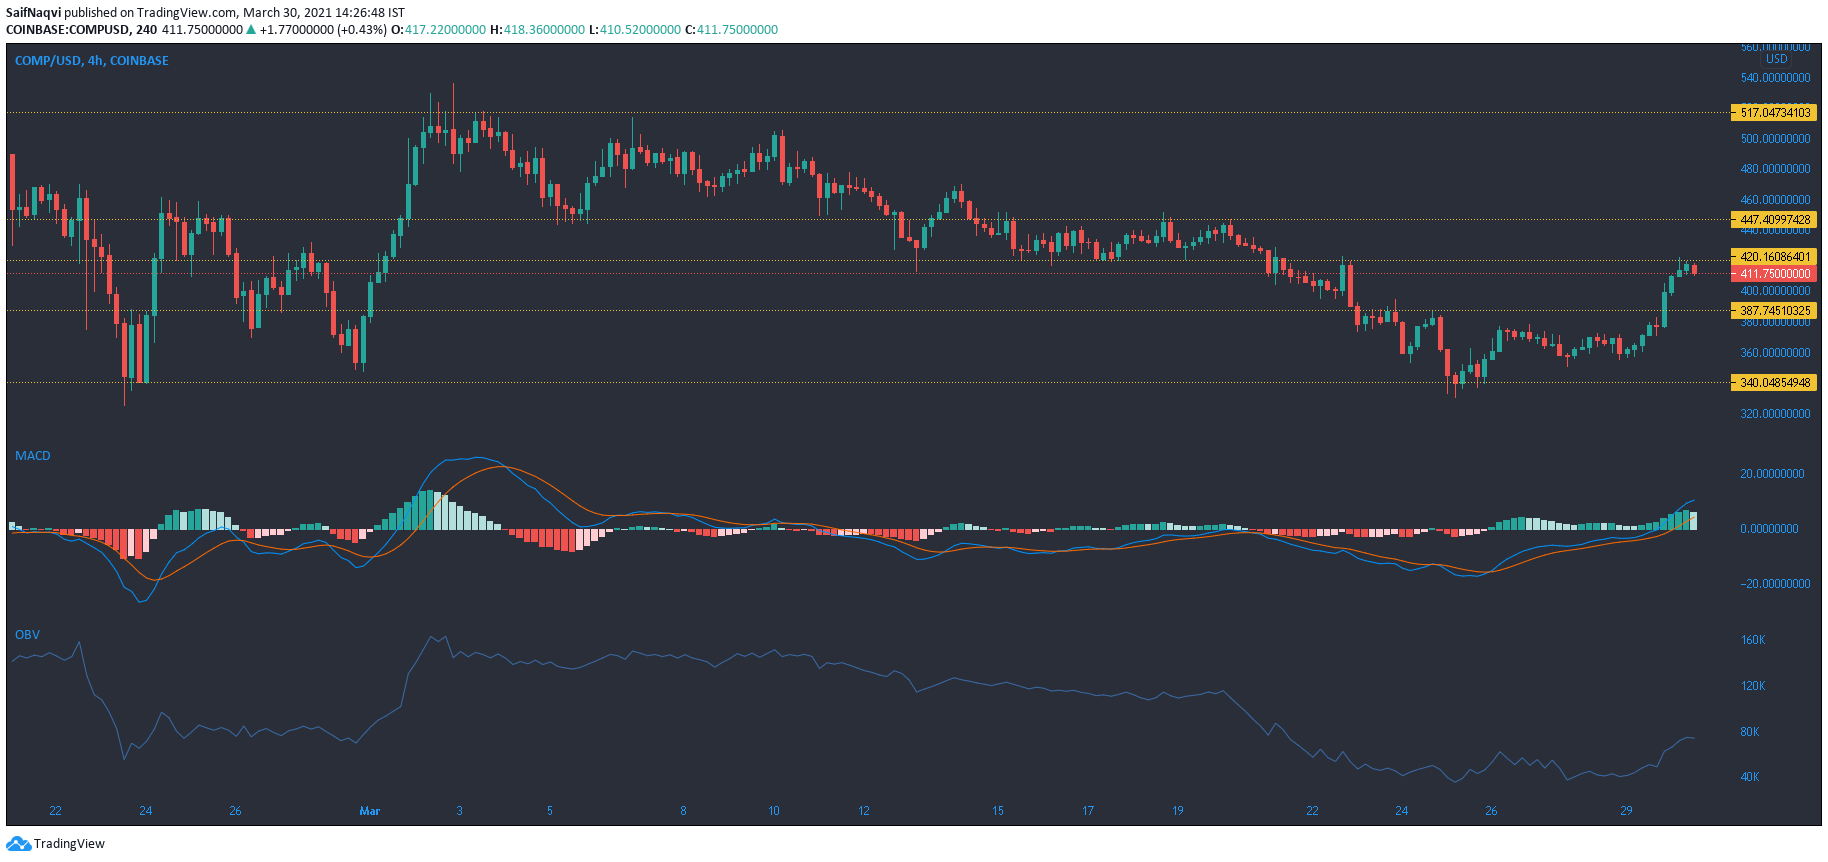
While Compound saw strong bullish price action during the beginning of March, gains were capped at the upper ceiling of $517. Selling pressure gripped the market from the aforementioned mark, and the price fell below multiple support levels on the 4-hour timeframe. Losses were finally cushioned at the strong support line of $340, a zone that provided relief during the late-February pullback as well.
The OBV showed buying at the $340-mark and the price recaptured $387.7 and flipped it to a support line. The next ceiling can be found at $447.4. However, some bearishness was seen in the market as the price approached its press-time resistance. While the MACD line moved above the Signal line, the histogram noted weakening momentum.


