Disclaimer: The findings of the following analysis are the sole opinions of the writer and should not be considered investment advice
In the last two days alone, Bitcoin has dropped beneath the $40k mark to touch $38.8k before a sharp rebound to the $41.4k-area. This was a 6% move to the upside. At the same time, LUNA dropped to $75.67 and at press time, was trading at $94.81. This represented gains of around 25% at a time when BTC saw a 6% move.
Why has LUNA rallied so hard?
One probable reason is the increased demand behind UST as market participants attempt to sell cryptocurrencies and hold on to stablecoins in a fearful market.
LUNA- 2 Hour Chart
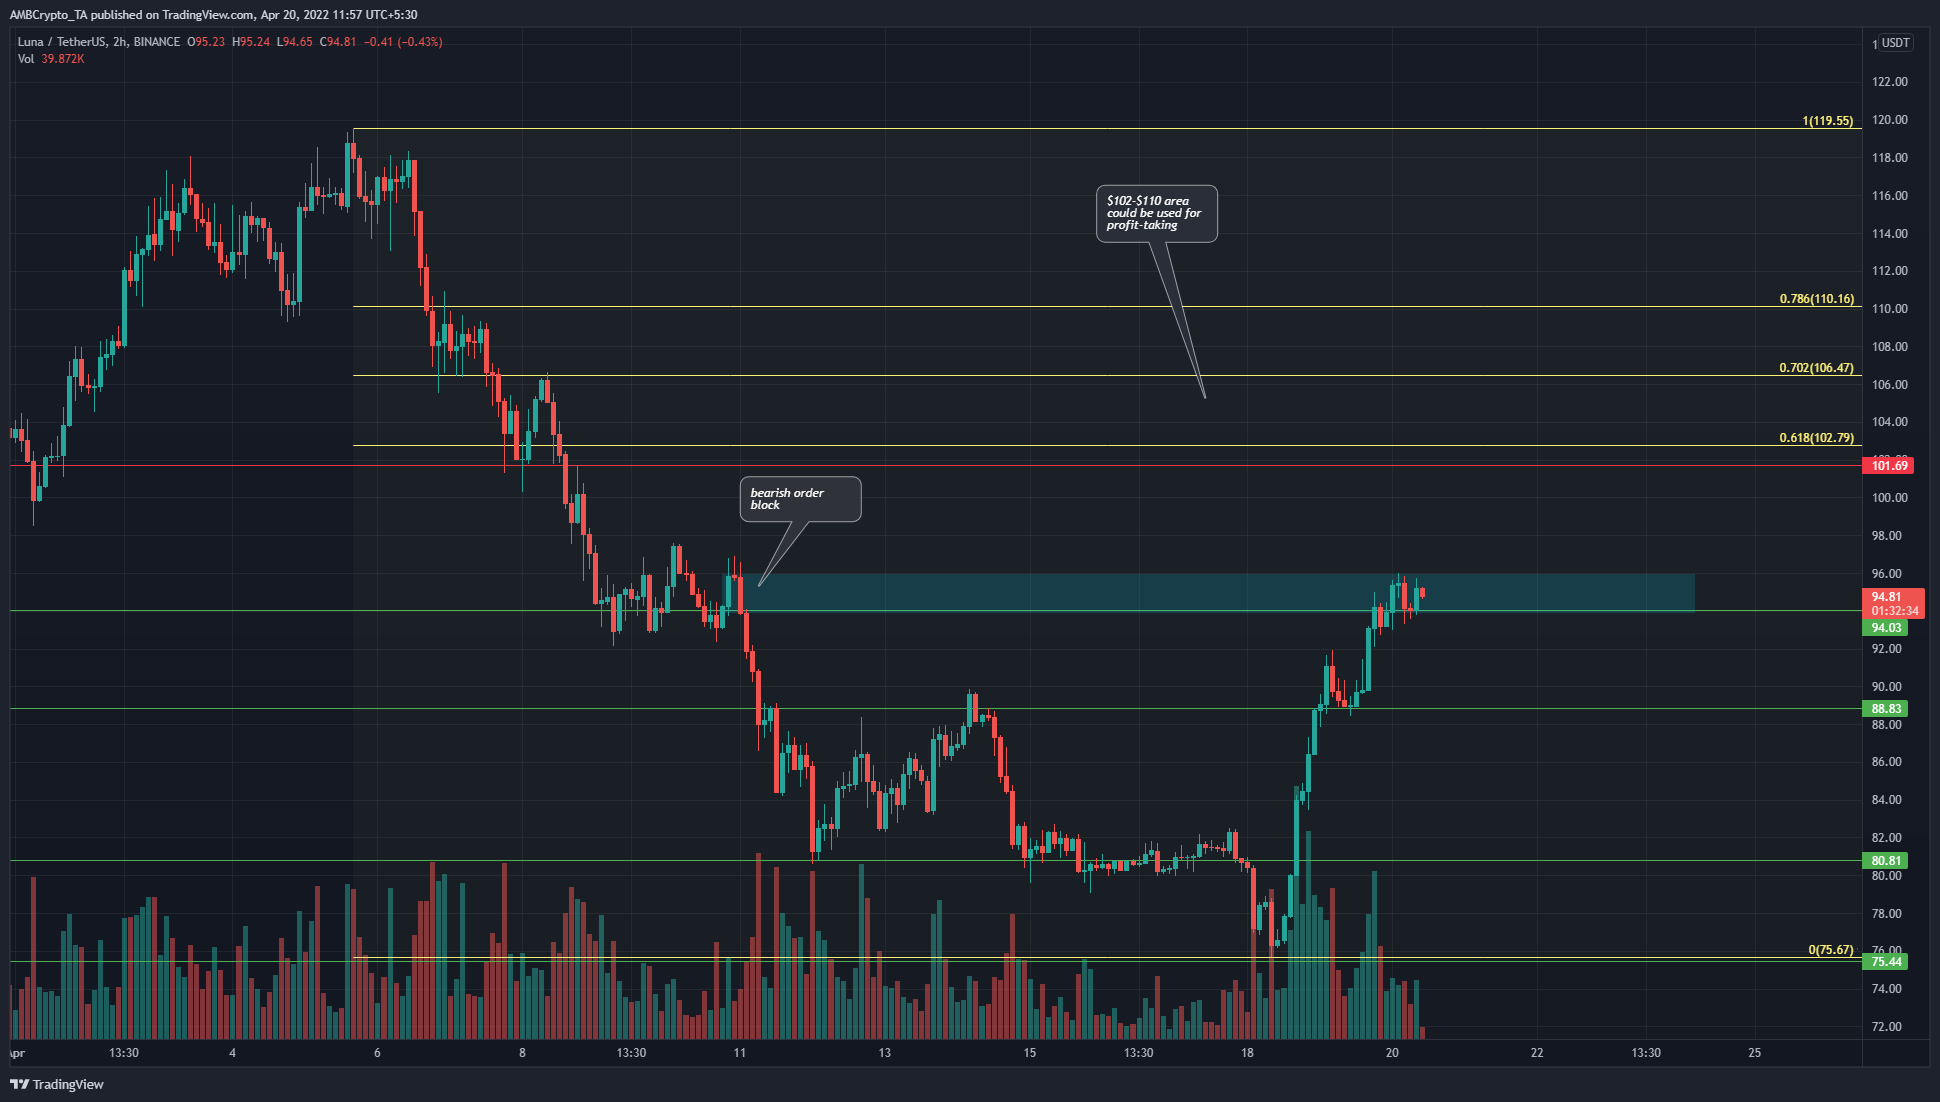
Source: LUNA/USDT on TradingView
For LUNA, there are two areas of immediate interest that market participants will have their eyes on in the next few days. The first is the $94-$96 area (cyan box) which has been a bearish order block from earlier this month.
At press time, the price attempted to breach this area of supply, and it is likely that LUNA would rise above $96 in the next few hours. A retest from above to confirm the $95 zone as demand could be a buying opportunity on lower timeframes.
Based on the drop from $119.55 to $75.67, a set of Fibonacci retracement levels (yellow) was plotted. They showed that the 61.8%-78.6% retracement levels of this downward move were at $102 and $110. This meant that $102-$110 is a strong area of resistance and can be used by traders as a take-profit zone.
Rationale
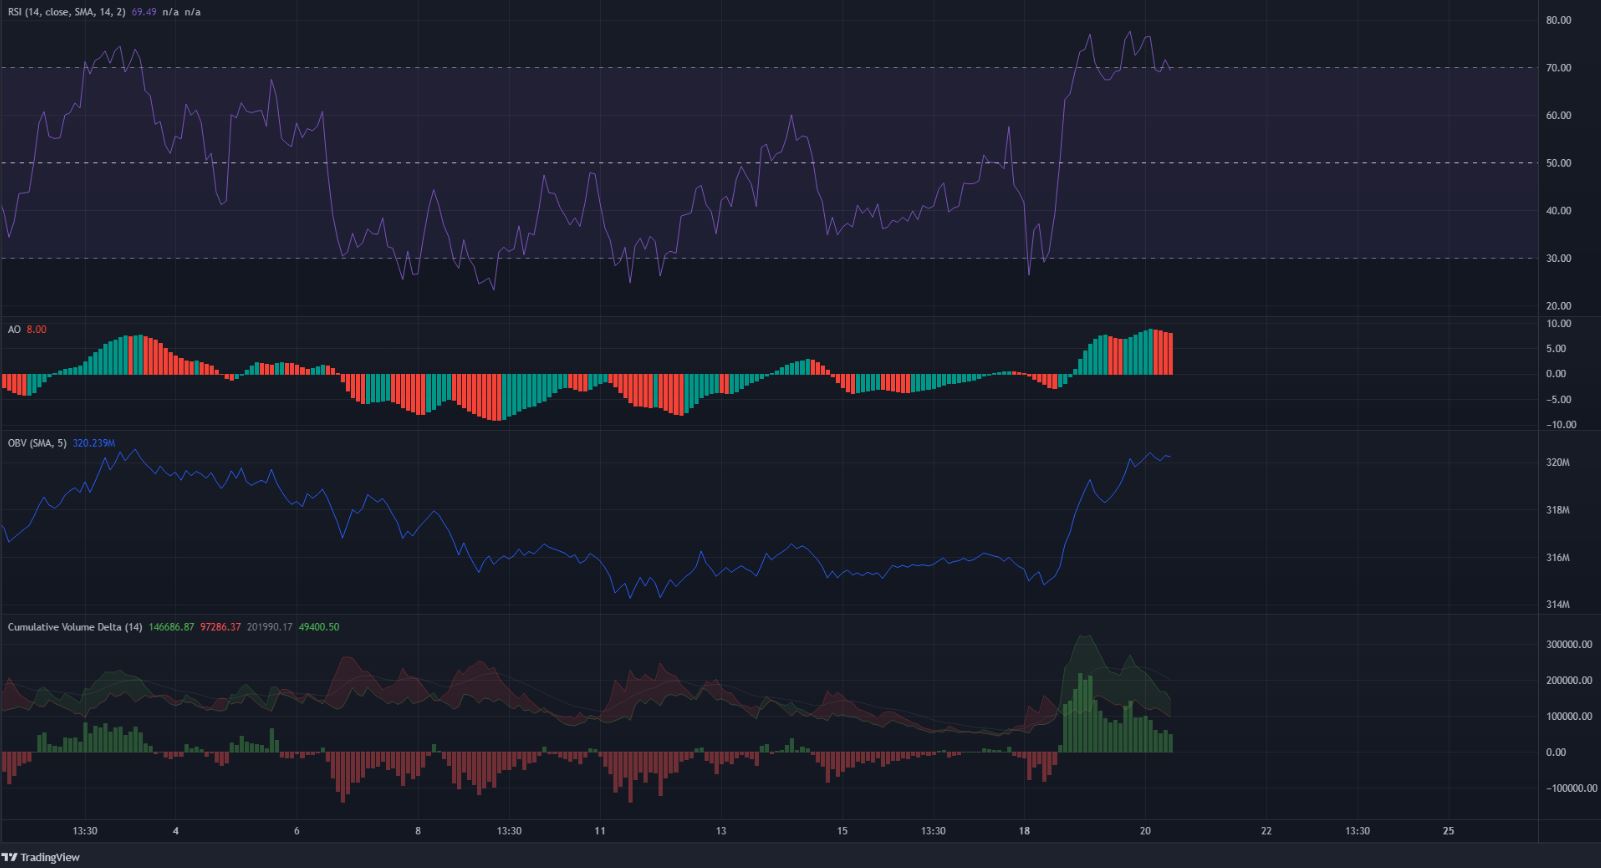
Source: LUNA/USDT on TradingView
The momentum indicators, RSI and AO, flashed strong bullish momentum. The RSI was in the overbought territory, but did not yet show a bearish divergence on the chosen timeframe. It was a similar tale with the Awesome Oscillator as well.
The OBV also broke the downtrend of the past two weeks and shot upwards to picture strong demand. The CVD displayed strong green bars to denote heavy buying pressure.
Conclusion
The $95-area on a bullish retest, or even the $88-$90 area in the event of rejection at $95, can be used to enter long positions targeting $102 and $110 as take-profit levels.
In the short-term, the market structure remains bullish for LUNA and further upside seems to be likely.