Polkadot: A cup, a handle, and what’s next for DOT’s price action

Polkadot [DOT] entered a cooling phase in the first week of April after delivering a healthy bull run in March. However, zooming out reveals that it has been trading in a cup and handle pattern. This might help predict DOT’s price action over the next few weeks.
The cup and handle pattern manifests as a curvature in the price action, such as a price dip and subsequent recovery. The price experiences a retracement once the curvature is complete, resulting in the “handle” part.
A cup, a handle, and what they mean exactly
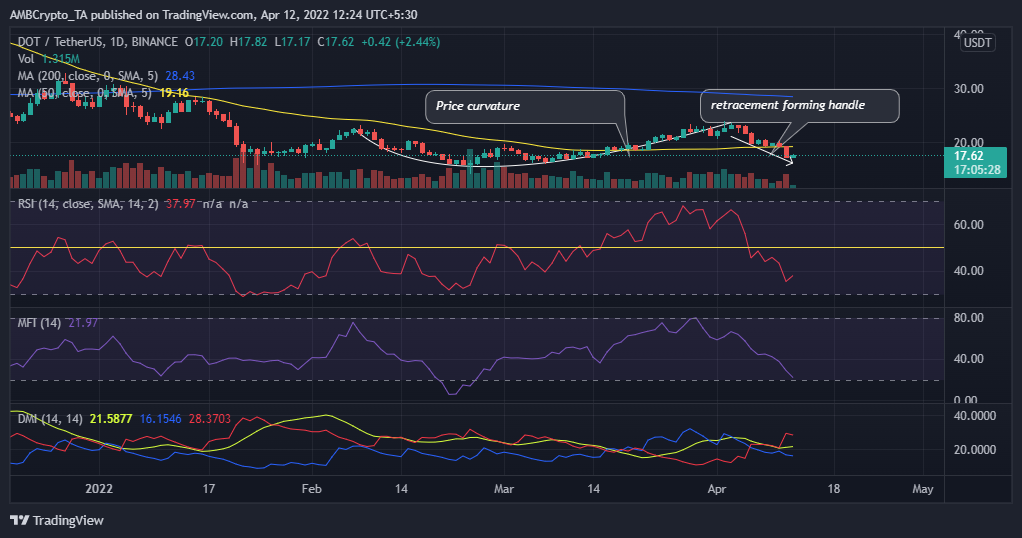
As can be seen from DOT’s 1-day price chart, this pattern kicked off on 8 February and ended on 3 April.
DOT was trading at $17.62, at the time of press – A roughly 26% drop from its latest top. The price correction has so far formed a healthy “handle” in the cup and handle pattern. The RSI assumed a downward trajectory but avoided the oversold zone on the 1-day chart. Furthermore, the MFI seemed to point towards significant outflows pushing towards the accumulation zone.
DOT’s 4-hour chart, on the other hand, pictured the price bouncing from its descending support after briefly dipping into oversold territory as per the RSI.
The DMI flashed strong bearish momentum. However, a +DI crossing above the ADX and –DI in the next few hours will confirm change in favor of bullish momentum.
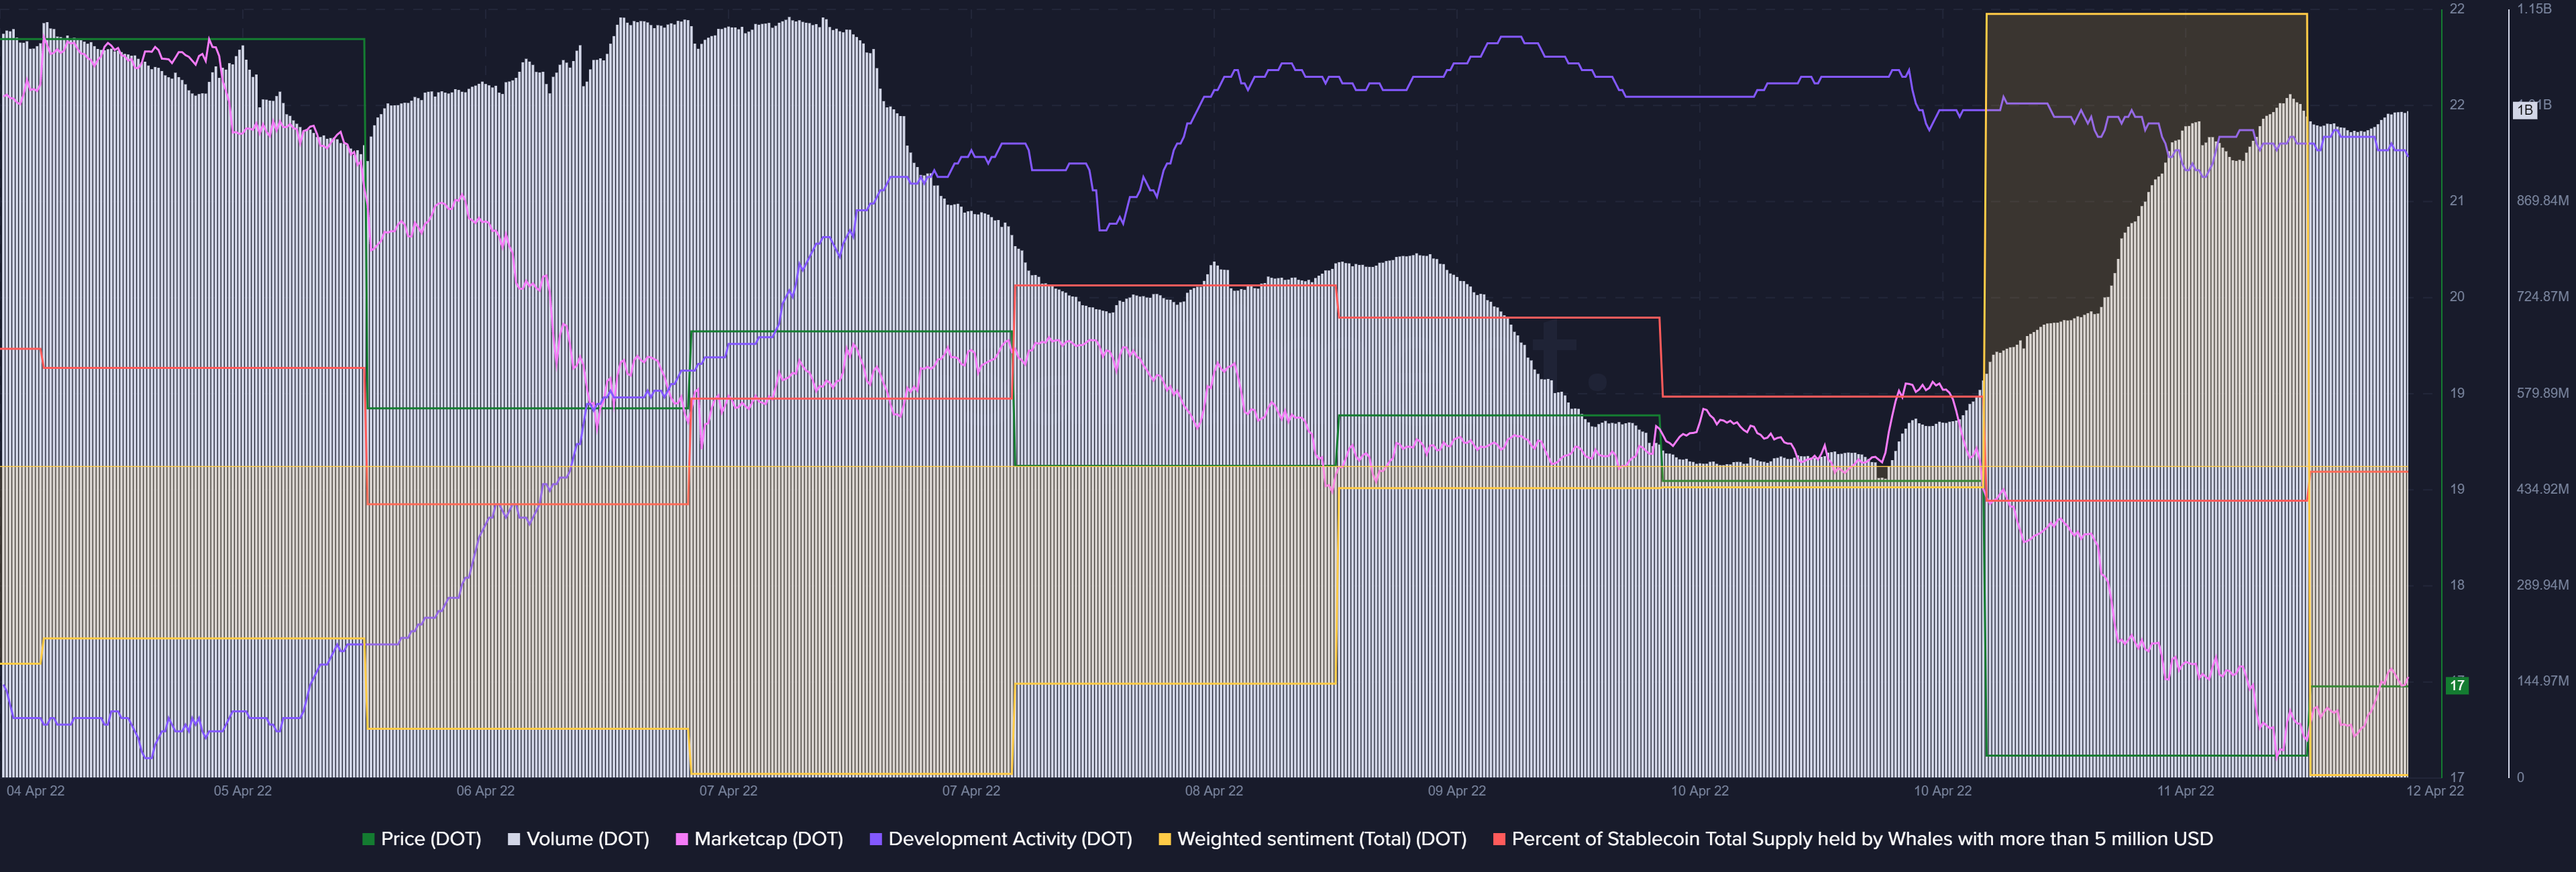
Some on-chain metrics may also help to determine whether momentum is really changing in favor of the bulls. Santiment’s attached chart, for instance, revealed that there has been a significant uptick in percentage whale holdings in the last 24 hours.
It also highlighted greater volumes over the last two days and a market cap uptick. All these elements, together, are bound to bode well for the altcoin’s price action.
What next, really?
The cup and handle pattern, in its current form (upright), is considered a bullish sign. Volume and market cap increases enforce the bullish sentiment.
However, it does not dispel any potential sell-offs along the way, especially in the event of unexpected bearish events.


