Shiba Inu, Polkadot, Uniswap Price Analysis: 12 April

With the global cryptocurrency market noting a correction of sorts over the last 24 hours, Shiba Inu bears flipped the long-term trendline support to resistance.
Similarly, Polkadot displayed a selling edge while its RSI moved along the oversold territory. Also, Uniswap corresponded with the overall bearish outlook and remained restricted below key resistance areas.
Shiba Inu (SHIB)
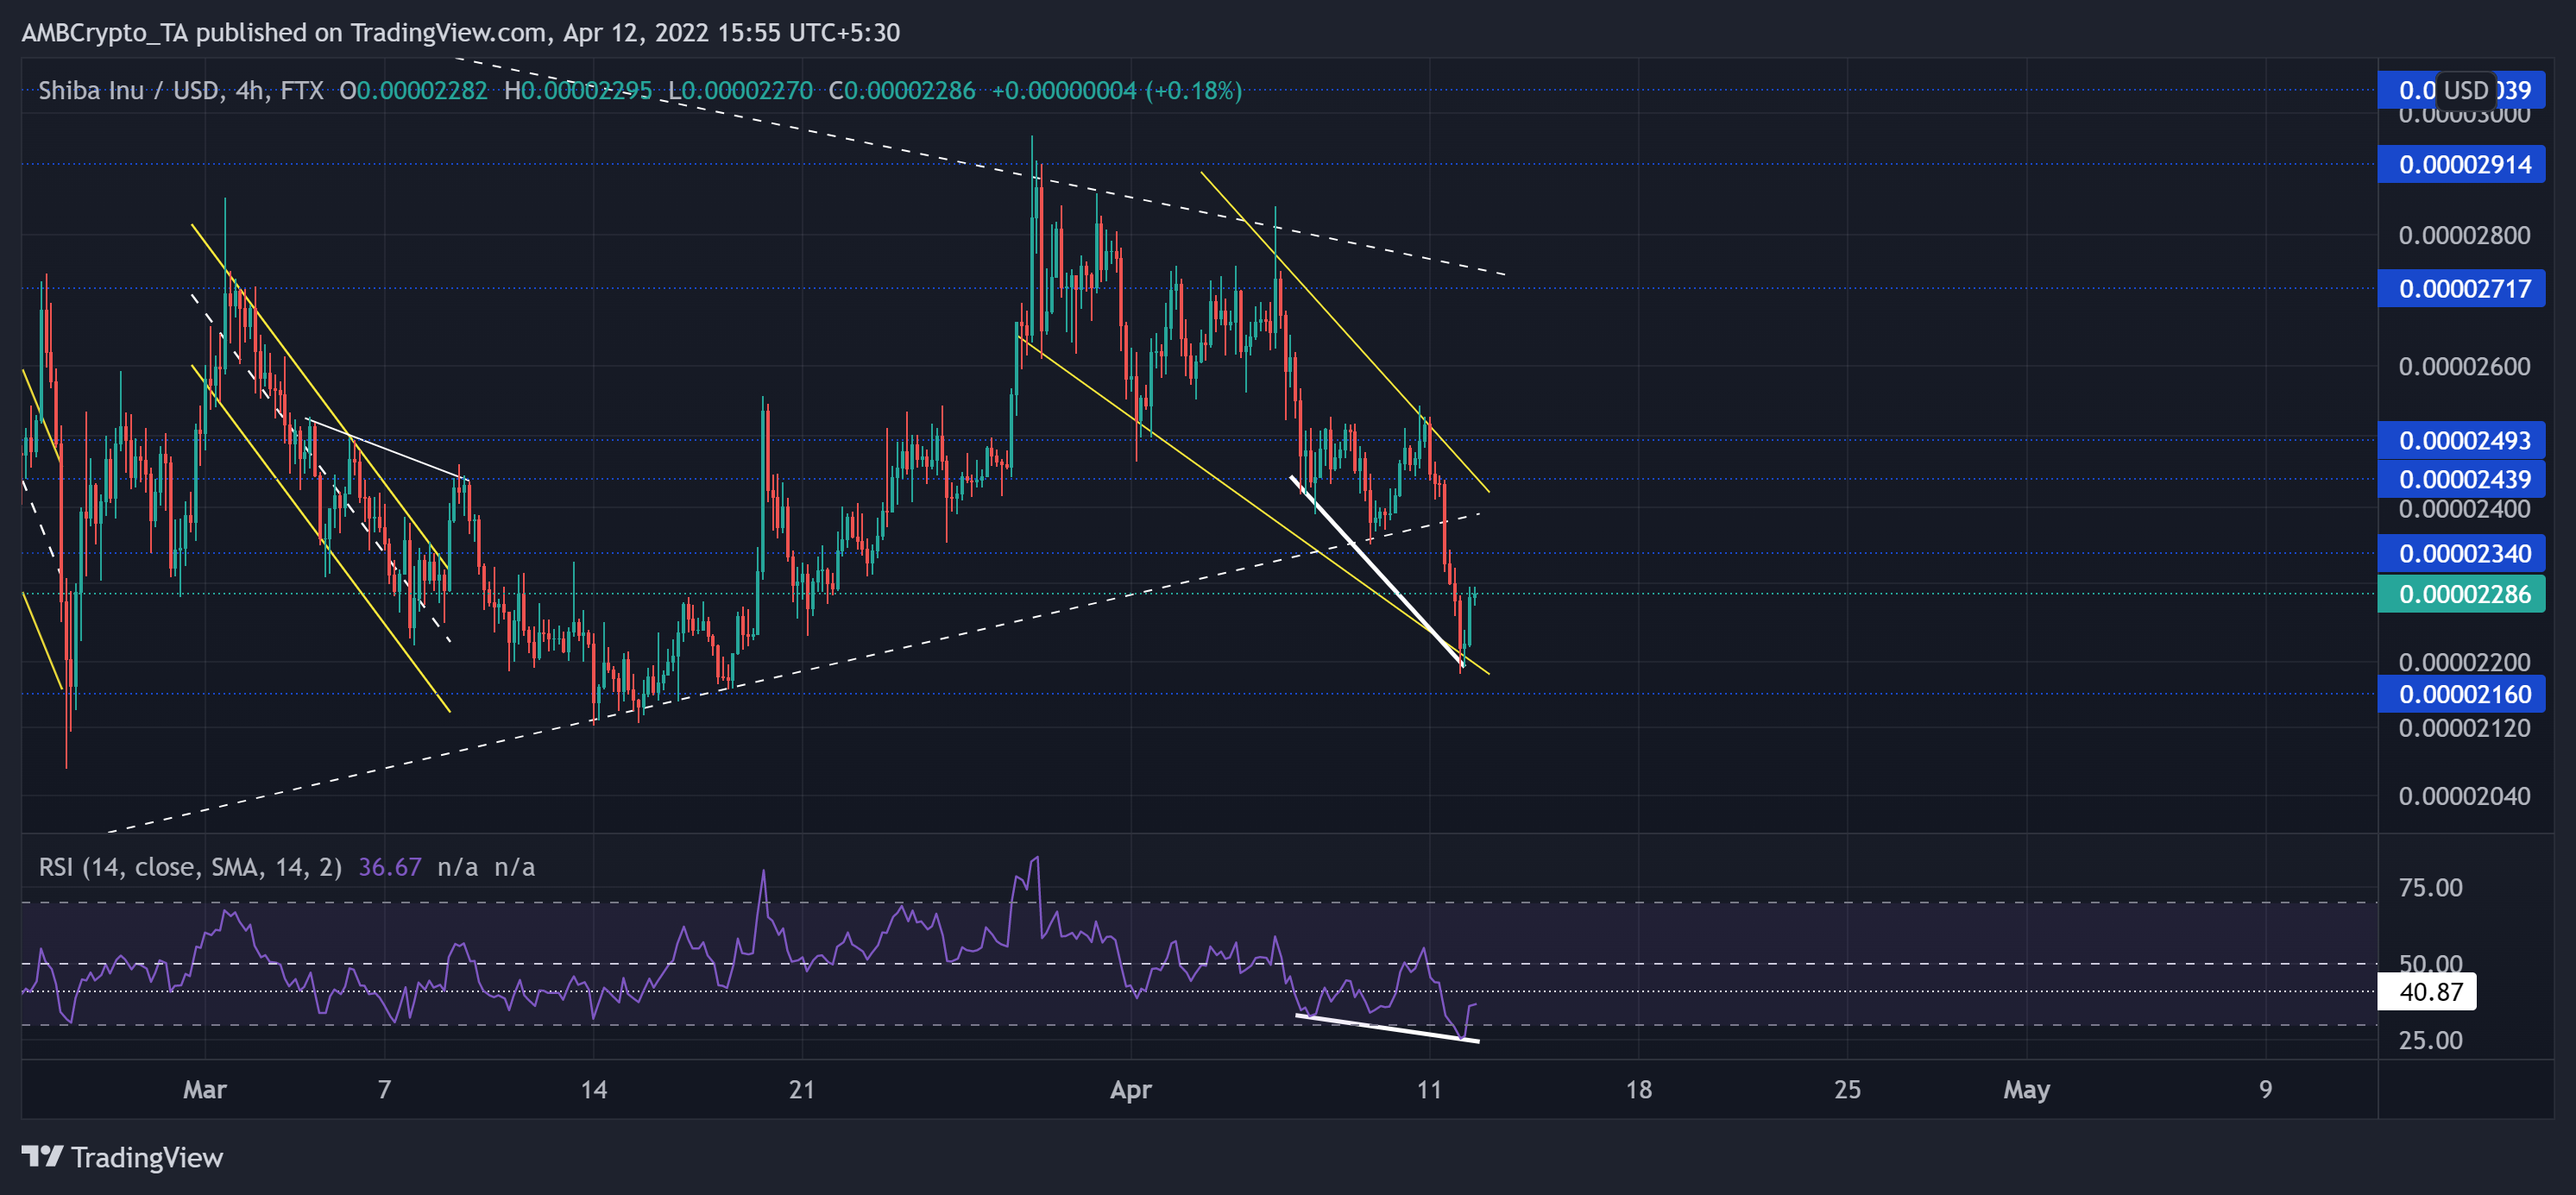
On its way up from its January lows, SHIB buyers pivoted the broader outlook in their favor. But the sellers ensured to keep the peaks under their influence ever since. (price is multiplied by 1000 from here, for simplicity)
The buyers did take charge of the five-month support from the $0.018-mark. SHIB bulls initiated a rally that led the alt to double its value before retracing from its long-term ceiling of $0.034-level. During this correction, it marked a falling wedge (yellow, reversal pattern) on its 4-hour chart.
At press time, SHIB traded at $0.02286. After witnessing a bullish divergence with price, the RSI saw a substantial recovery. A close above the 40-mark resistance would brace the RSI for a midline retest.
Polkadot (DOT)
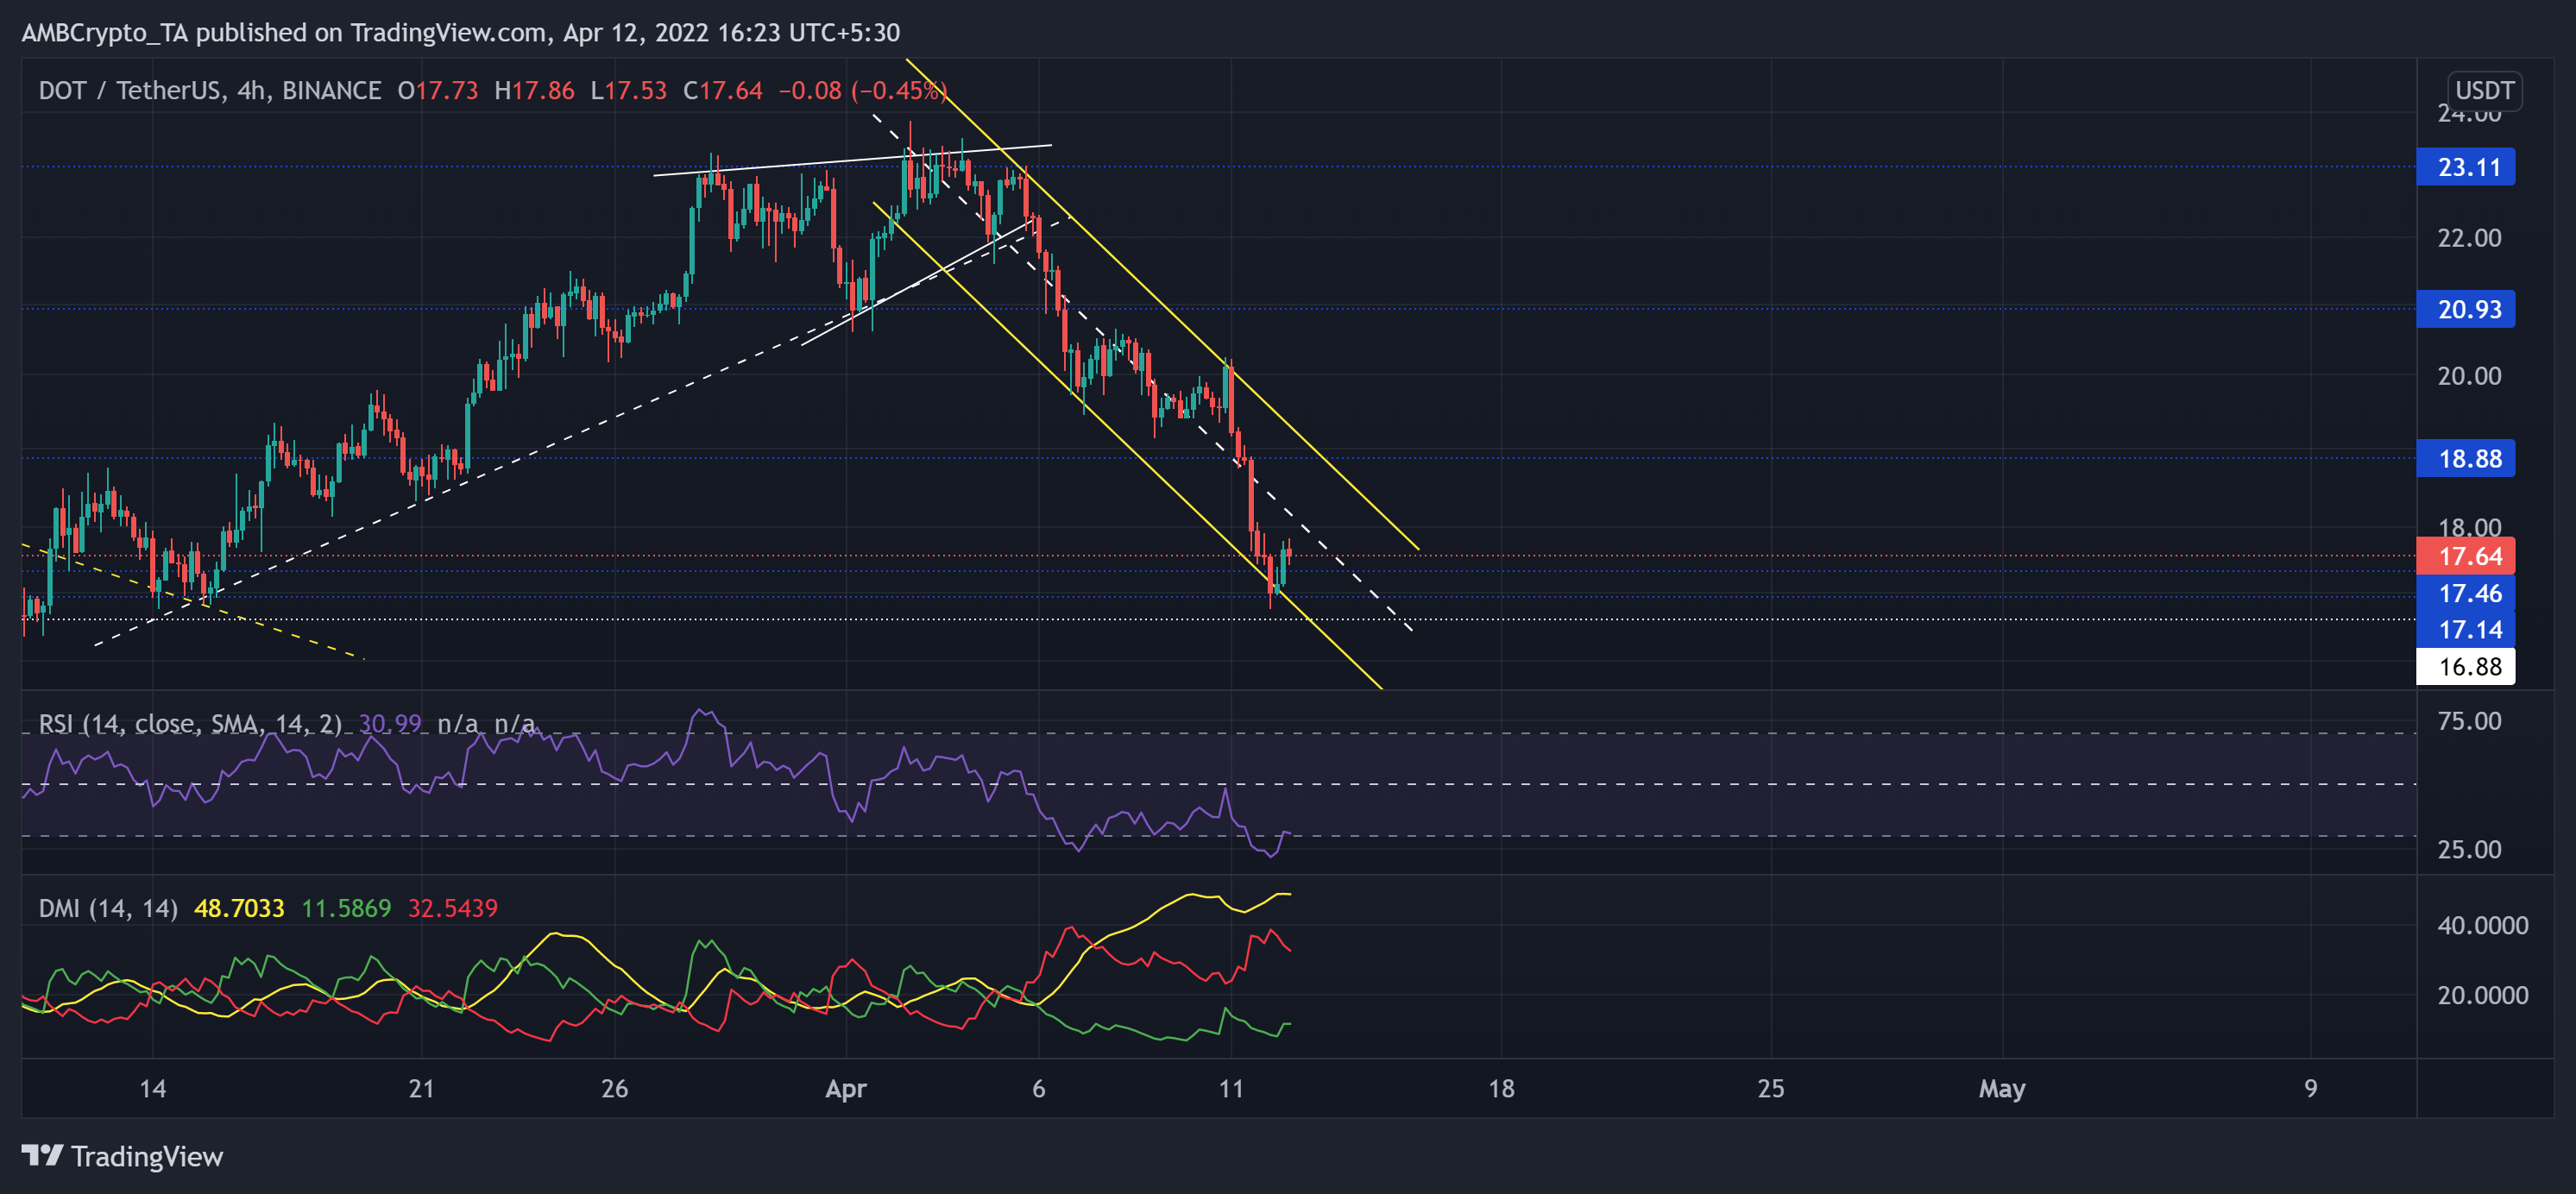
The previous bearish phase (from its ATH) led the alt to lose more than 74.5% of its value and plunge toward its seven-month low on 24 February.
However, the recent bullish rally marked bullish trendline support (now resistance) (white, dashed) while the alt tested the $23-mark. At the $23 resistance, DOT witnessed an expected rising wedge breakdown. This steep downslide transposed into a descending channel (yellow).
At press time, DOT was trading at $17.64. The RSI struggled to recover from the oversold mark yet. In the current scenario, the sellers have claimed a superior edge. Moreover, with the +DI still refusing to look north, DOT eyed at a slow recovery.
Uniswap (UNI)
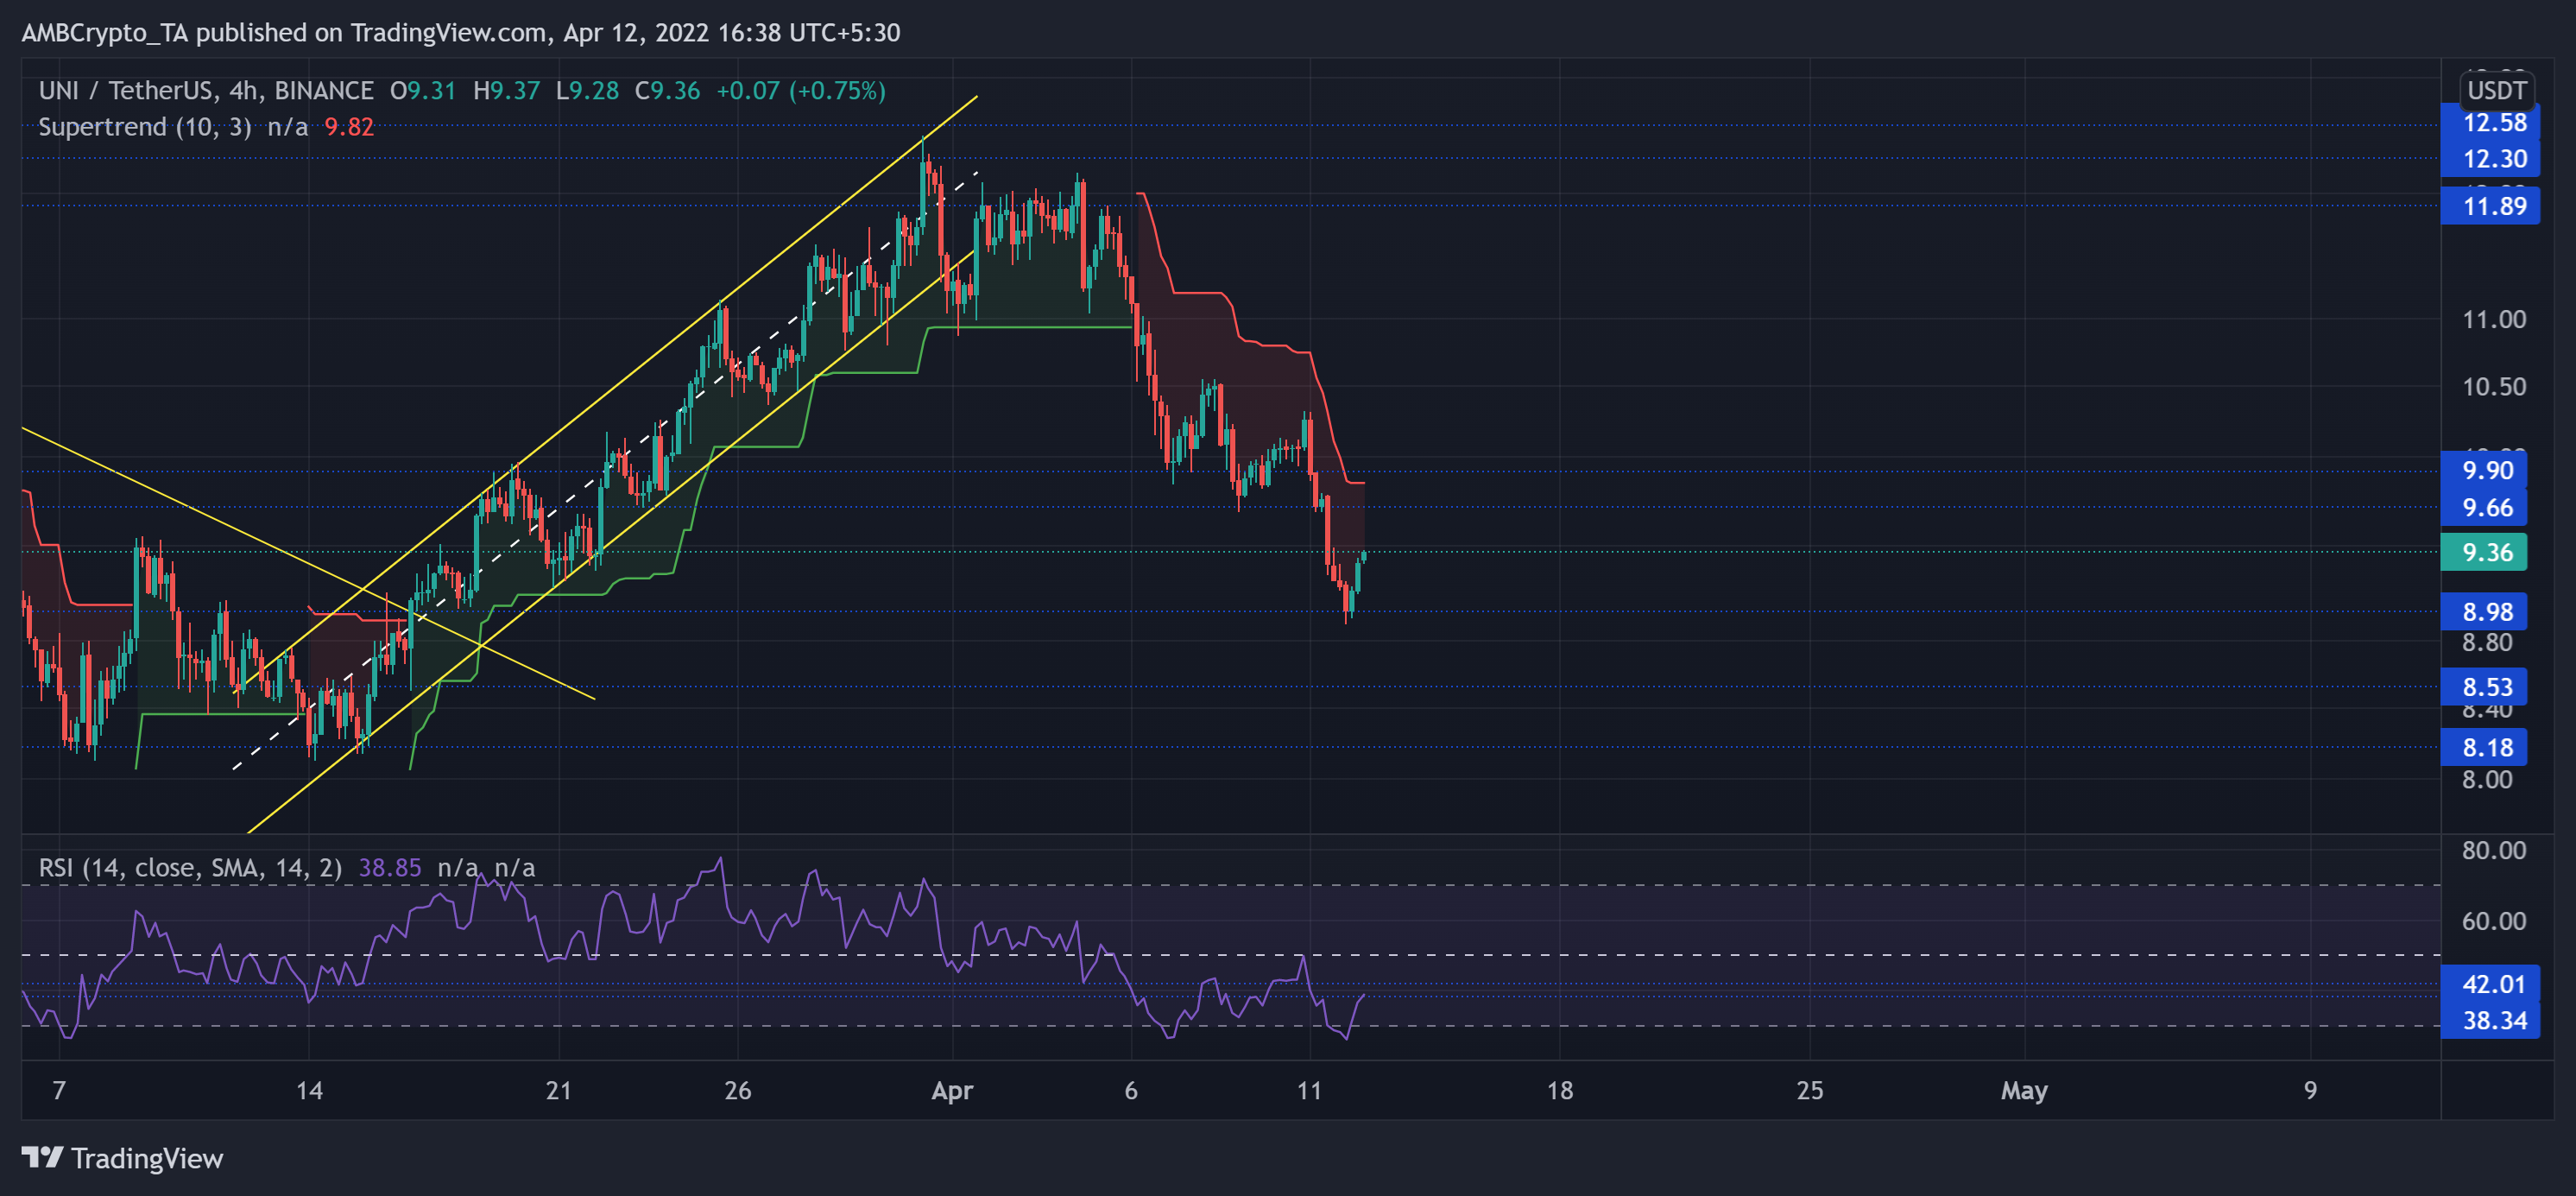
Since the bulls lost their previous base at the $15-mark, UNI found an oscillation range between the $7.5-$12.5 mark over the last three months. The recent bull rally noted a 65.7% ROI (from its January lows) and touched its seven-week high on 31 March.
Since then, the bears initiated a nearly 25% retracement whilst the Supertrend depicted a bearish advantage. Any recovery from the $9-support could face a barrier at the $9.6-level.
At press time, the alt was trading at $9.36. After facing strong resistance at the equilibrium, the RSI would need to topple the 38-42 range resistance to iterate a decreasing selling vigor.