Polkadot, Aave, Nano Price Analysis: 12 June

Polkadot, Aave, and Nano mimicked the downward trend haunting the crypto-market as its total market cap shrunk by 5.57% over the previous day. After noting consolidation post the 7 June fall, these alts once again found themselves in bearish territory on 10 June, breaking through the support levels they had clung on to for weeks.
Nano and Aave saw high market volatility, while both DOT and Nano seemed to be heading for the oversold zones. Nano lost 23% of its valuation over the past week, while DOT and Aave lost 19.8% and 27.6% at the same time, respectively. However, the latter coins saw slight gains on the four-hour chart with the emergence of green candlesticks at press time.
Polkadot [DOT]
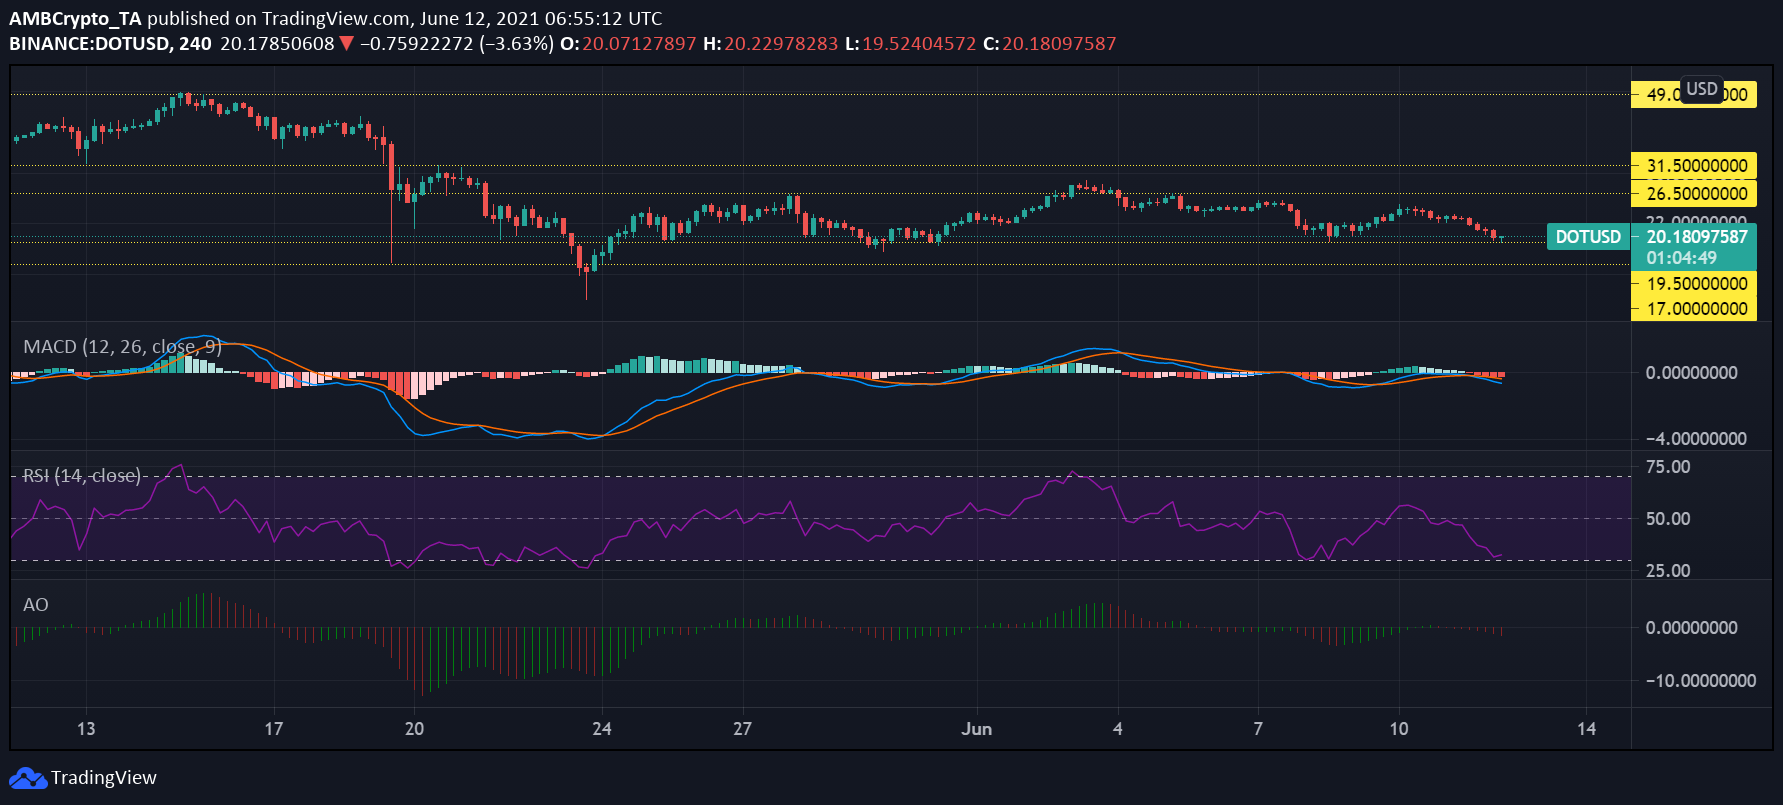
DOT lost 11.2% of its valuation over the past 24 hours, retaining the 9th position on CoinMarketCap. The token was priced at $20.12 at press time, down by over 59% from its all-time high in May. It had been oscillating between the $26.5 resistance and $19.5 support marks since May 21 and was testing that support, at the time of writing. A price drop further could see the coin dropping to the next support at $17.
The Relative Strength Index or RSI dropped down into bearish territory the previous day, steadily heading towards the oversold zone. If selling pressure continues to mount, the coin could be slated for a price correction in the future. It must be noted, however, that the constant downtrend of the indicator did note a tiny uptick.
According to the Awesome Oscillator’s histogram, bearish momentum had started to dominate DOT’s price movement. The MACD line also registered a bearish crossover around the same time, and the token could lose further valuation going forward.
Aave [AAVE]
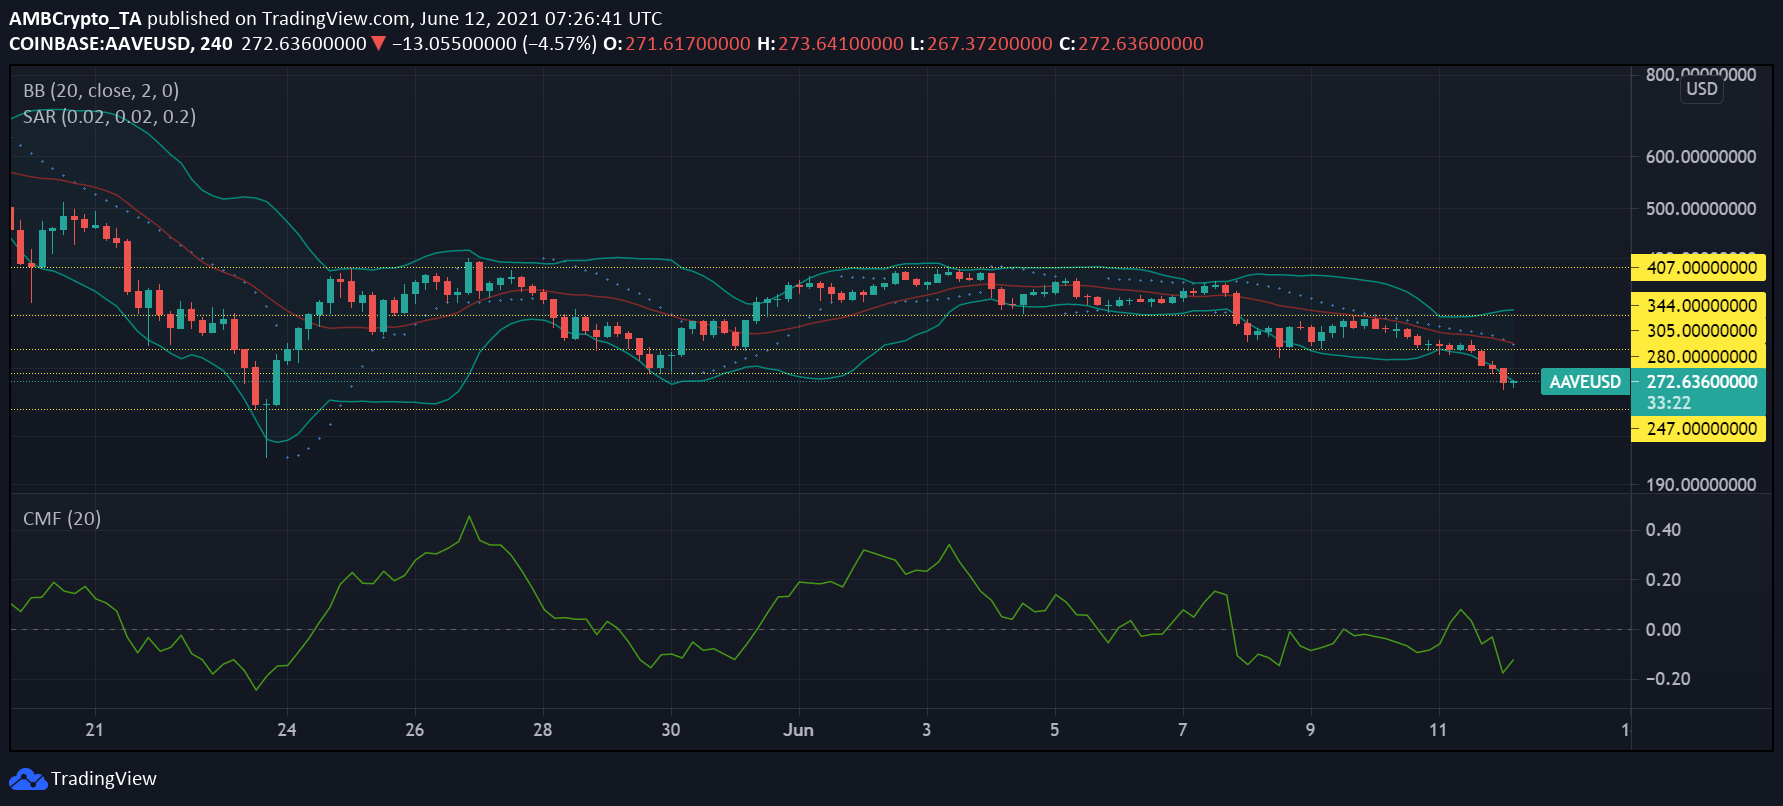
After losing over 16% of its valuation during the 7 June market consolidation, Aave seemed to be heading for a price correction. However, the coin had been following a downward trend since 10 June and lost 11% of its value over the past 24 hours. Breaking through the $280-support level, the coin seemed to be heading for the next support at $247.
The Parabolic SAR’s dotted line has been hovering above the candlesticks since June 7, indicating that the coin’s price movement was following a bearish trend. The divergence of the Bollinger Bands suggested that the market was highly volatile and the price action could be sharp going forward.
Moreover, capital outflows overtook inflows as the Chaikin Money Flow dropped down from the equilibrium level on 11 June .
Nano [NANO]

Following sideways movement since 23 May, Nano noted a one-day price fall of 6.9% and a seven-day price fall of 23%. It was ranked 82nd on CoinMarketCap. On the 4-hour chart, Nano was sandwiched between $9 and the $6.4-resistance and support levels, respectively, since May, breaking through via a downward trend last night.
The Relative Strength Index or RSI for Nano highlighted dominant selling pressure. Although the downward movement had somewhat flattened, any further plunge would push the asset into the oversold zone.
The Awesome Oscillator’s histogram indicated that the asset’s price movement had bearish momentum as the red bars continued to form below the equilibrium. Furthermore, the divergence of the Bollinger Bands since 11 June pointed to high market volatility and sharp price action.


