Polkadot, Algorand, Compound Price Analysis: 10 March

Polkadot was moving north from its symmetrical triangle but awaited confirmation before rising towards its ATH of over $42, at press time. Algorand regained the 23.6% Fibonacci level on the charts, but the bears could mount a comeback over the next few sessions. Finally, COMP held on to the $469.66-support and registered rangebound behavior as equilibrium was maintained in the market.
Polkadot [DOT]
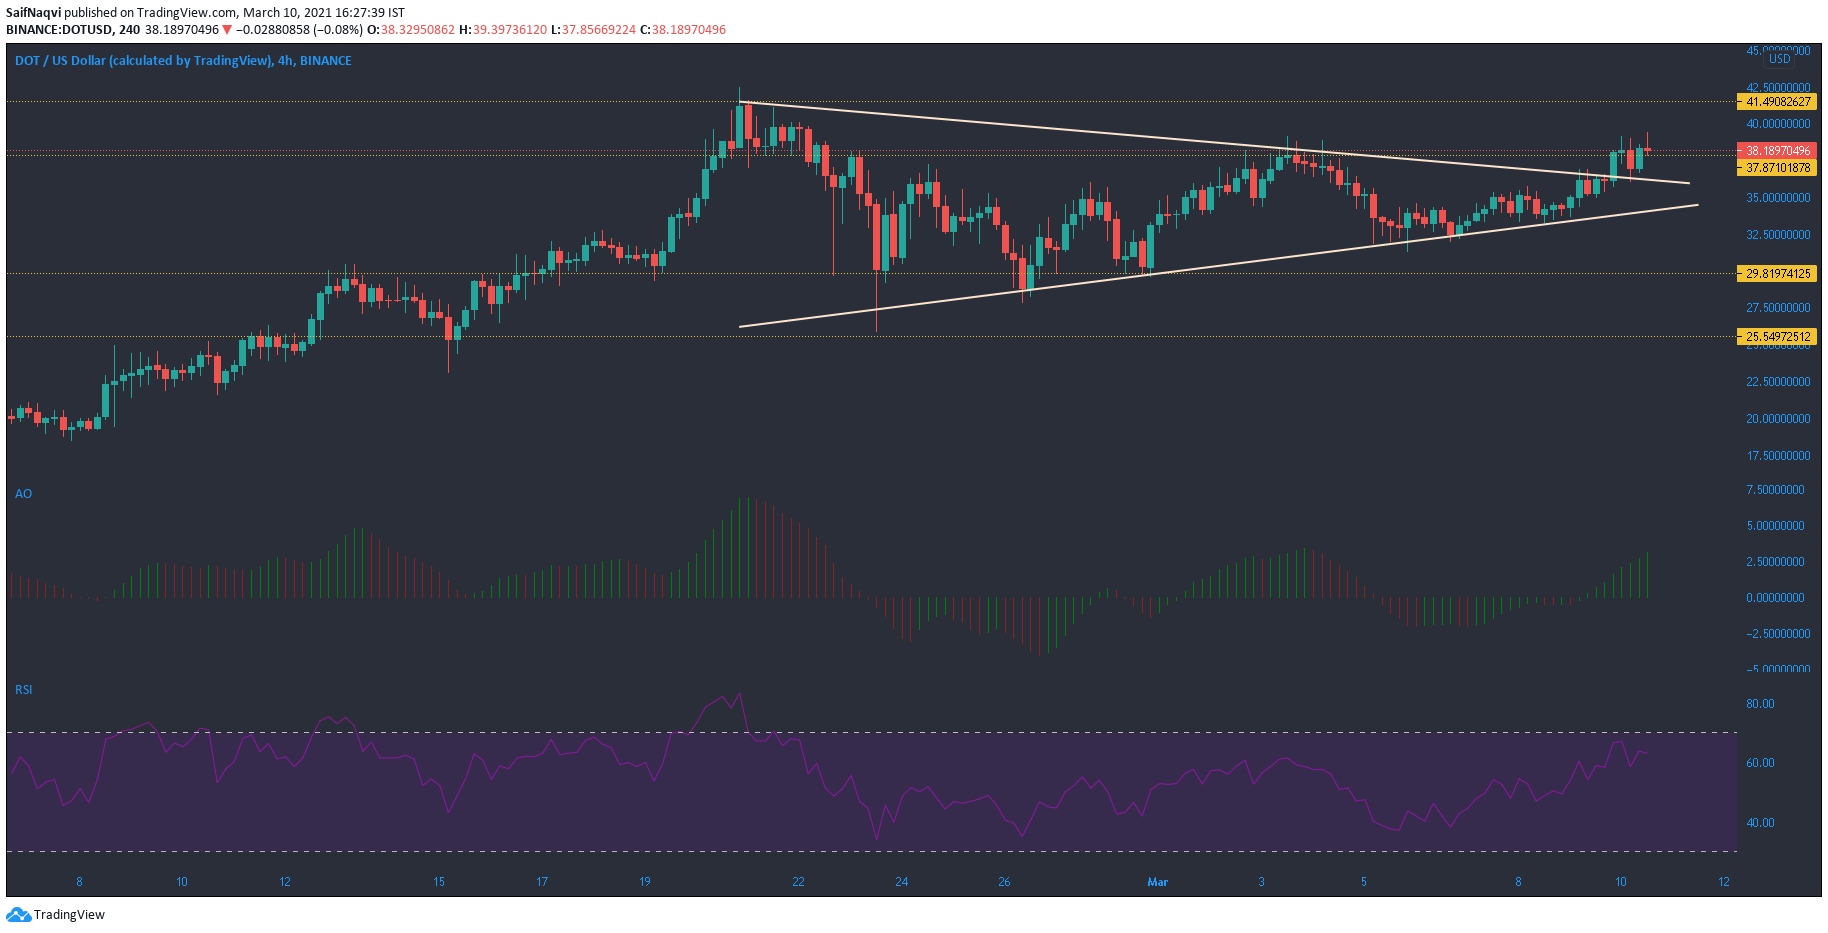
A northbound breakout from its symmetrical triangle saw Polkadot flip the $37.87-resistance and move upwards on the 4-hour timeframe. At the time of writing, the world’s sixth-largest cryptocurrency was trading at a little over $38, just 10% off its ATH of over $42.
The Awesome Oscillator pictured strong momentum on the bullish side, while the RSI was just below the overbought zone. Healthy trading volumes and buying activity were positive signs moving forward. The next ceiling for the market’s bulls is the $41.5-level and the bears could struggle to contain the uptrend.
However, the appearance of a bearish doji over the last trading session presented an obstacle for the bulls. A reversal at the press time price level would see the price move back within its pattern and invalidate the breakout.
Algorand [ALGO]
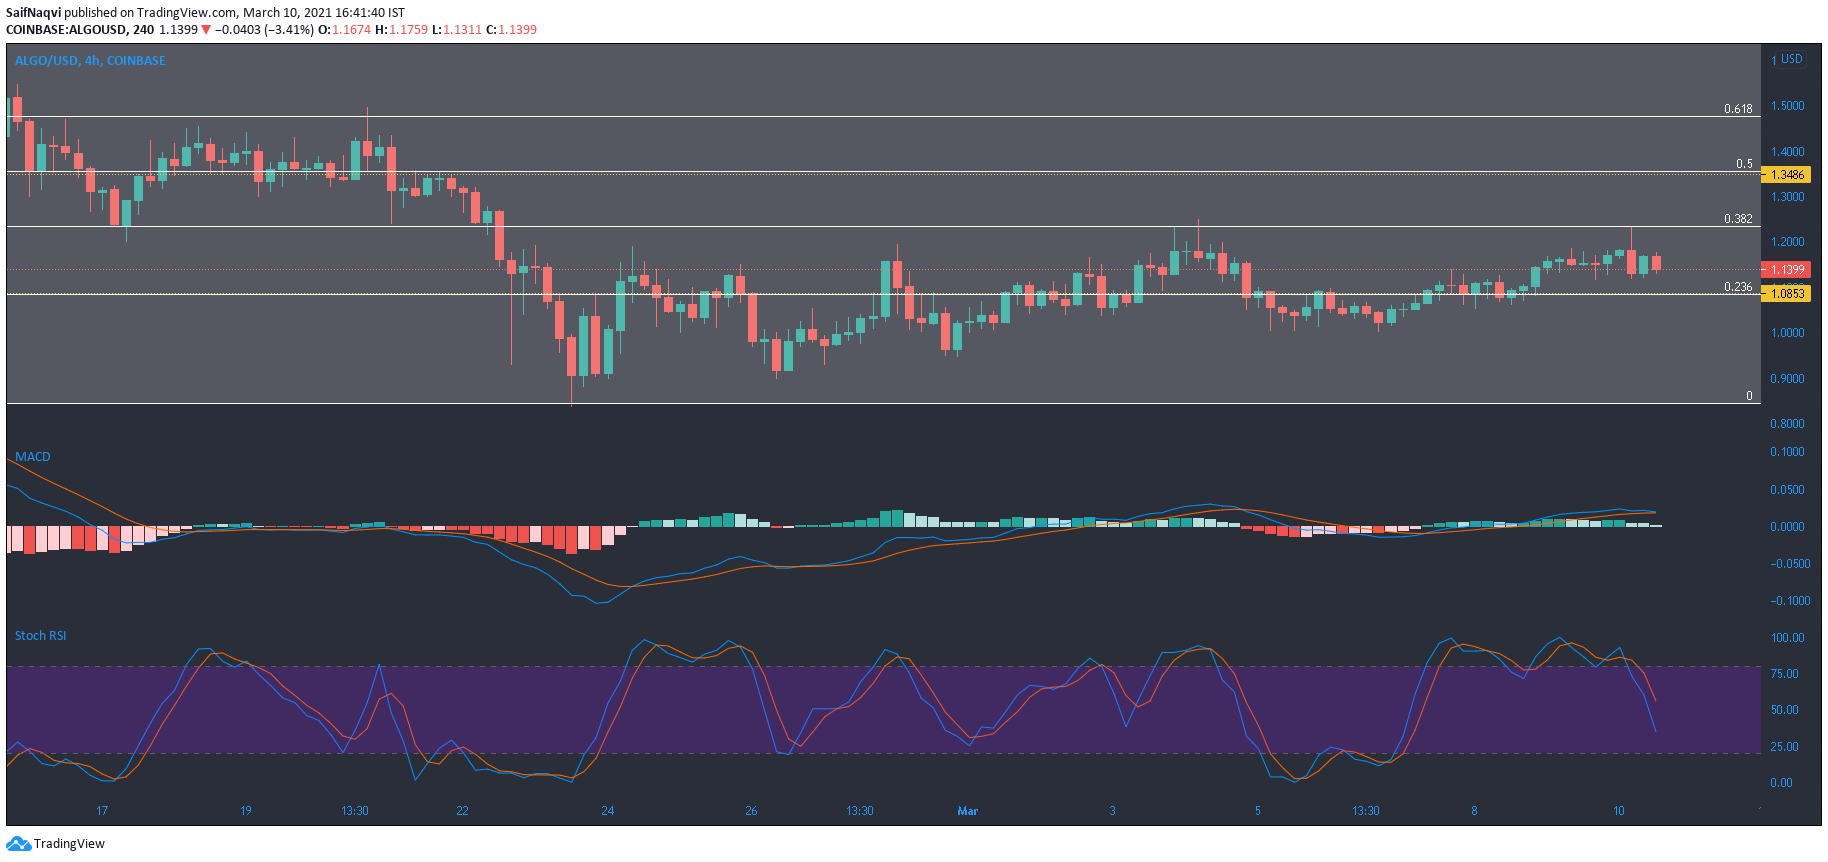
The MACD on Algorand presented a balanced market after the price climbed above the 23.6% Fibonacci level. Going by the trend over the past couple of weeks, the press time level has been met by swift rejection by the bears, with the price moving lower on each occasion.
The Stochastic RSI was an accurate indicator to predict ALGO’s short-term movement since the price lost out to its Fibonacci level every time the index reversed trajectory from the overbought region. Such could be the case this time around as well as the Stochastic RSI moved lower from the upper region and some bearishness was noted in the price.
Compound [COMP]
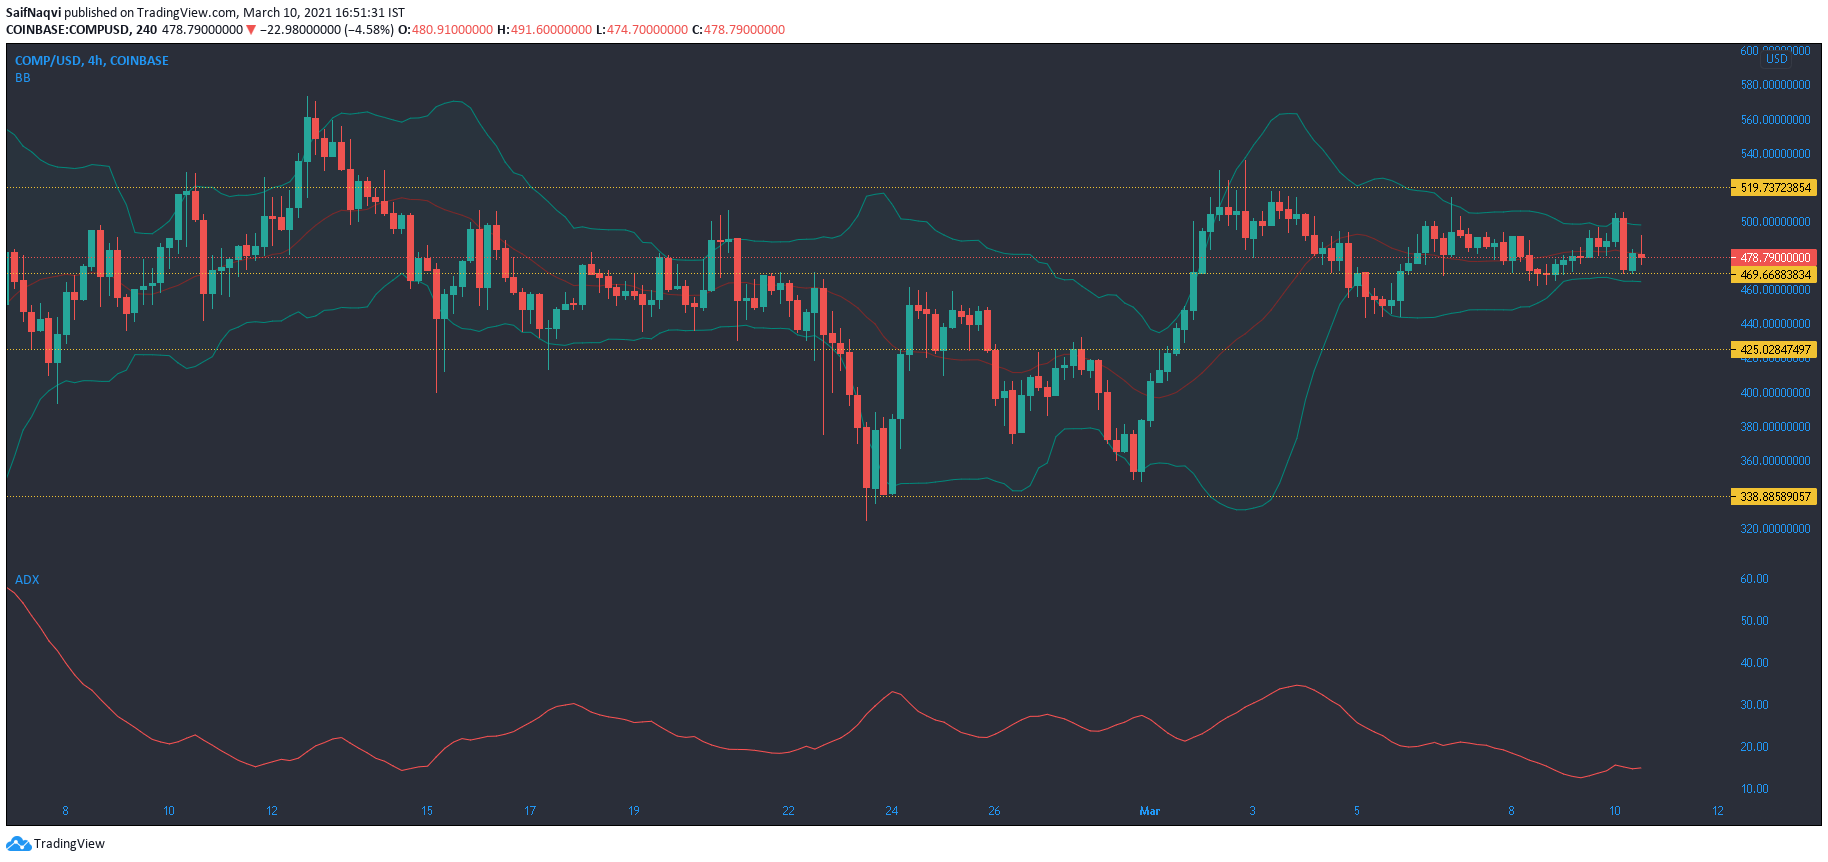
The $469.66-level served as a strong region of support for Compound over the past few days and prevented a southbound move on the 4-hour chart. An ADX reading of 15 indicated that neither side had control over the market. The 24-hour trading volumes ticked up, at press time, but were below $300 million and did not signal a breakout in either direction.
The Bollinger Bands registered a low degree of volatility in the market, something that also worked against a sharper price action. Expect the consolidation phase to spill over the next few sessions before COMP can resume its uptrend.


![Rising bond yields put Bitcoin [BTC] at risk — a Fed rate hike could be next](https://ambcrypto.com/wp-content/uploads/2026/08/IMG_4752-e1785656382502.webp)