Polkadot, Chainlink, Ethereum Classic Price Analysis: 09 June

Polkadot is faced with an uphill task to recover from the recent lows considering the stunted buying pressure for the asset. Chainlink, which was oscillating between its restricted range from the beginning of June, saw a downward trend as it broke past a major support level. Finally, Ethereum Classic saw low volatility and fewer volumes over the past week.
While the three assets displayed a bearish trend, Polkadot and Chainlink might be headed for better recoveries whereas Ethereum Classic could be in for further consolidation.
Polkadot [DOT]
Polkadot’s Gavin Wood, on June 8, announced the schedule and some recommendations for the rollout of Parachain Slot Auctions, by which projects can secure a lease to build on Polkadot’s Kusama network.
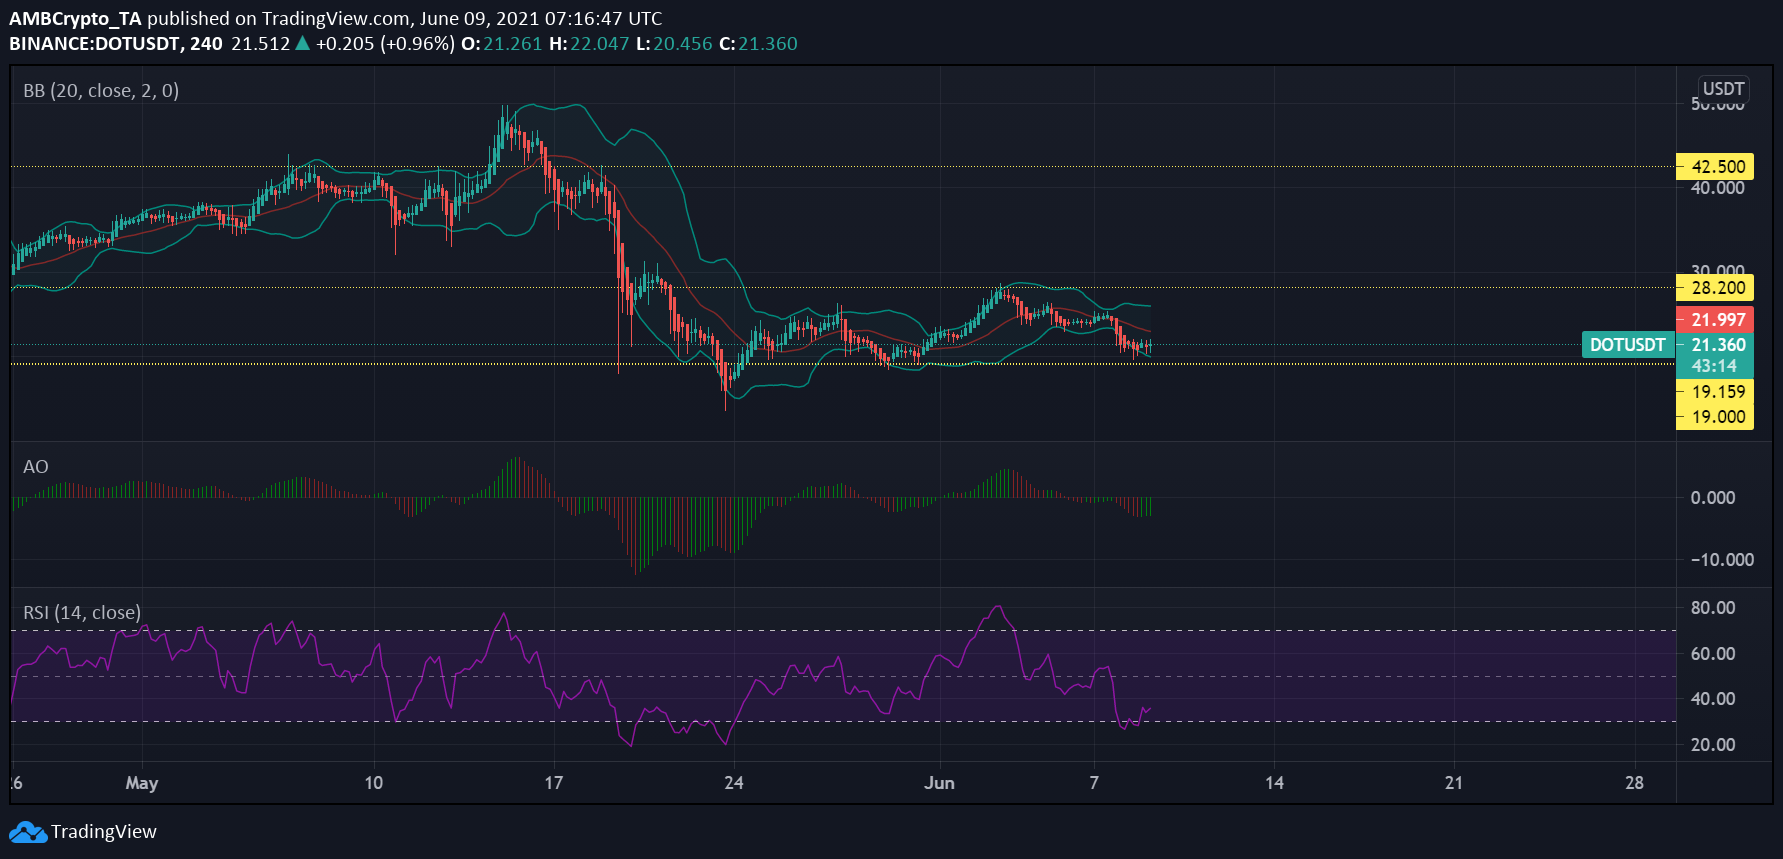
DOT had a strong beginning this month as it displayed signs of recovery from the May 19 price dip. The coin climbed up by almost 40% in 3 days and soon after fell down by 27% in the following week. At press time, DOT traded at $21.3 and ranked 9 on CoinMarketCap.
Relative Strength Index for the asset highlighted that selling pressure was dominant as the indicator fluctuated between 28-33. However, diverged Bolinger Bands highlighted increased volatility which could give rise to a more expanded price range in the near future.
Further, Awesome Oscillator suggested that bullish momentum was creeping in for the asset which could move the price up. DOT was seen oscillating between the $19 and $28.2 support and resistance after the price drop on May 19.
Chainlink [LINK]
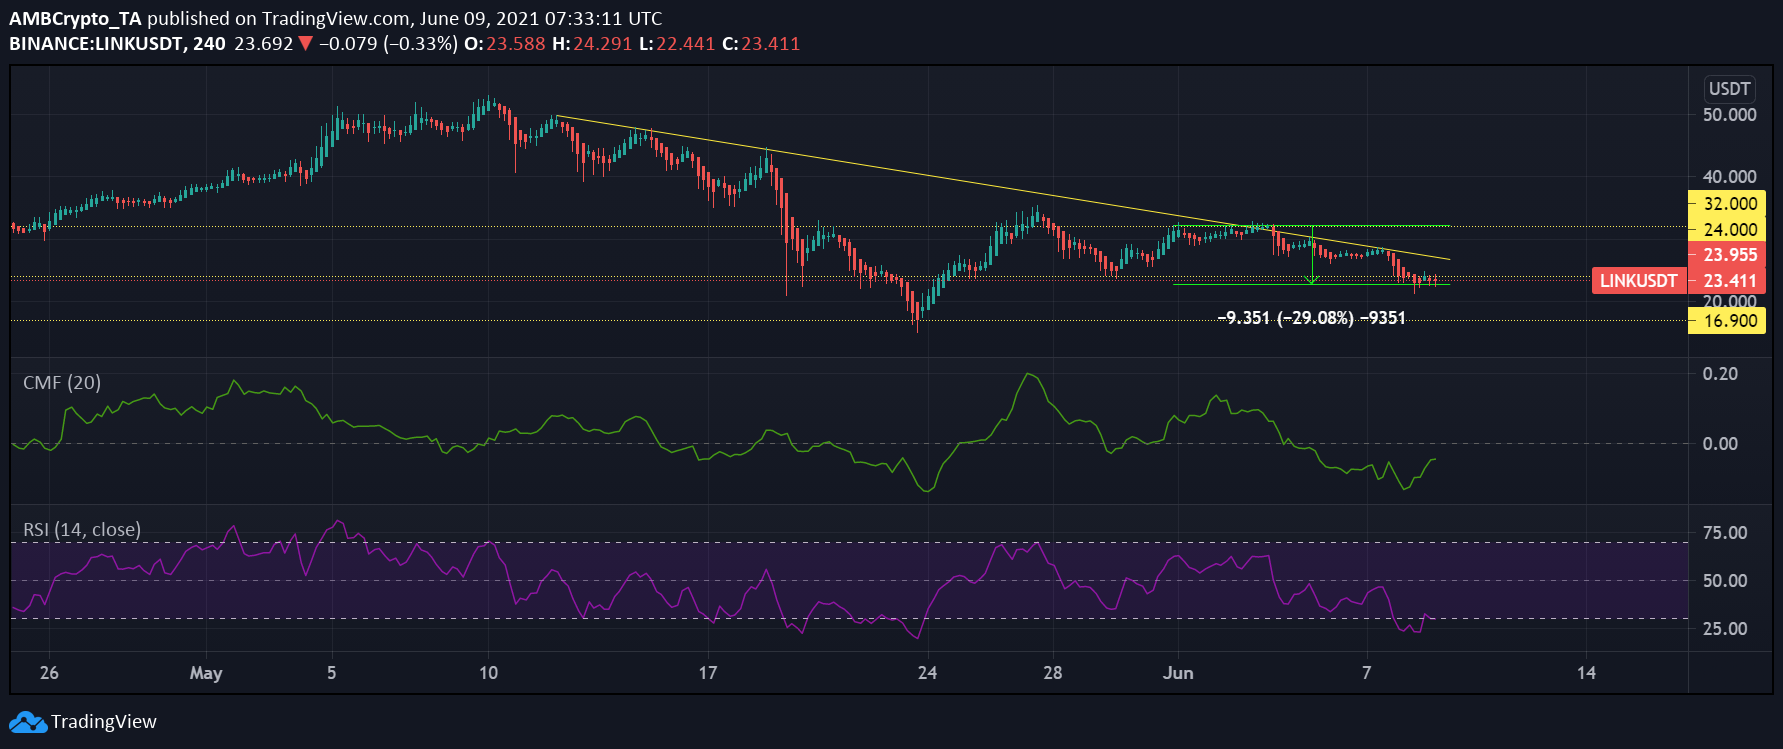
Chainlink’s 4-hour chart suggested that the cryptocurrency was steadily forming lower highs since the middle of May. In hindsight, a recent analysis highlighted a lack of retail traders in the Chainlink market which could have implicating effects on LINK’s short-mid trajectory.
The 14th ranked asset on CoinMarketCap saw a 29% price fall since the beginning of June and tested the $24 support multiple times at press time. Relative Strength Index for LINK highlighted that the asset was in the oversold zone. The indicator lingered at levels a little above 30 at the time of writing.
Moreover, Chaikin Money Flow pointed towards more capital outflows than inflows, as the indicator maintained its position below the zero-line.
Ethereum Classic [ETC]

Ethereum Classic traded at $56 at press time and ranked 21 on CoinMarketCap. Short-bodied candlesticks on ETC’s 4-hour chart highlighted that price action for the asset was restricted. Further, it underwent a 17.5% price dip in the last two days and tested the $50.3 support level on June 8.
However, Squeeze Momentum Indicator showed bearish pressure receding. Furthermore, Relative Strength Index highlighted its recovery from the oversold zone on June 8. The selling pressure, however, was still dominant for the asset. This recovery coupled with the receding bearish pressure could point towards a trend reversal for the asset.