Polkadot, Dash, Uniswap Price Analysis: 24 January

Polkadot was rejected at range highs as the price made a weak attempt to break above, and was headed toward the $16.5 price level. Continuation of the downtrend of the past two weeks can not yet be ruled out for Dash as it bounced off a level of support, while Uniswap was in a strong uptrend and projected a target of $12.39.
Polkadot [DOT]
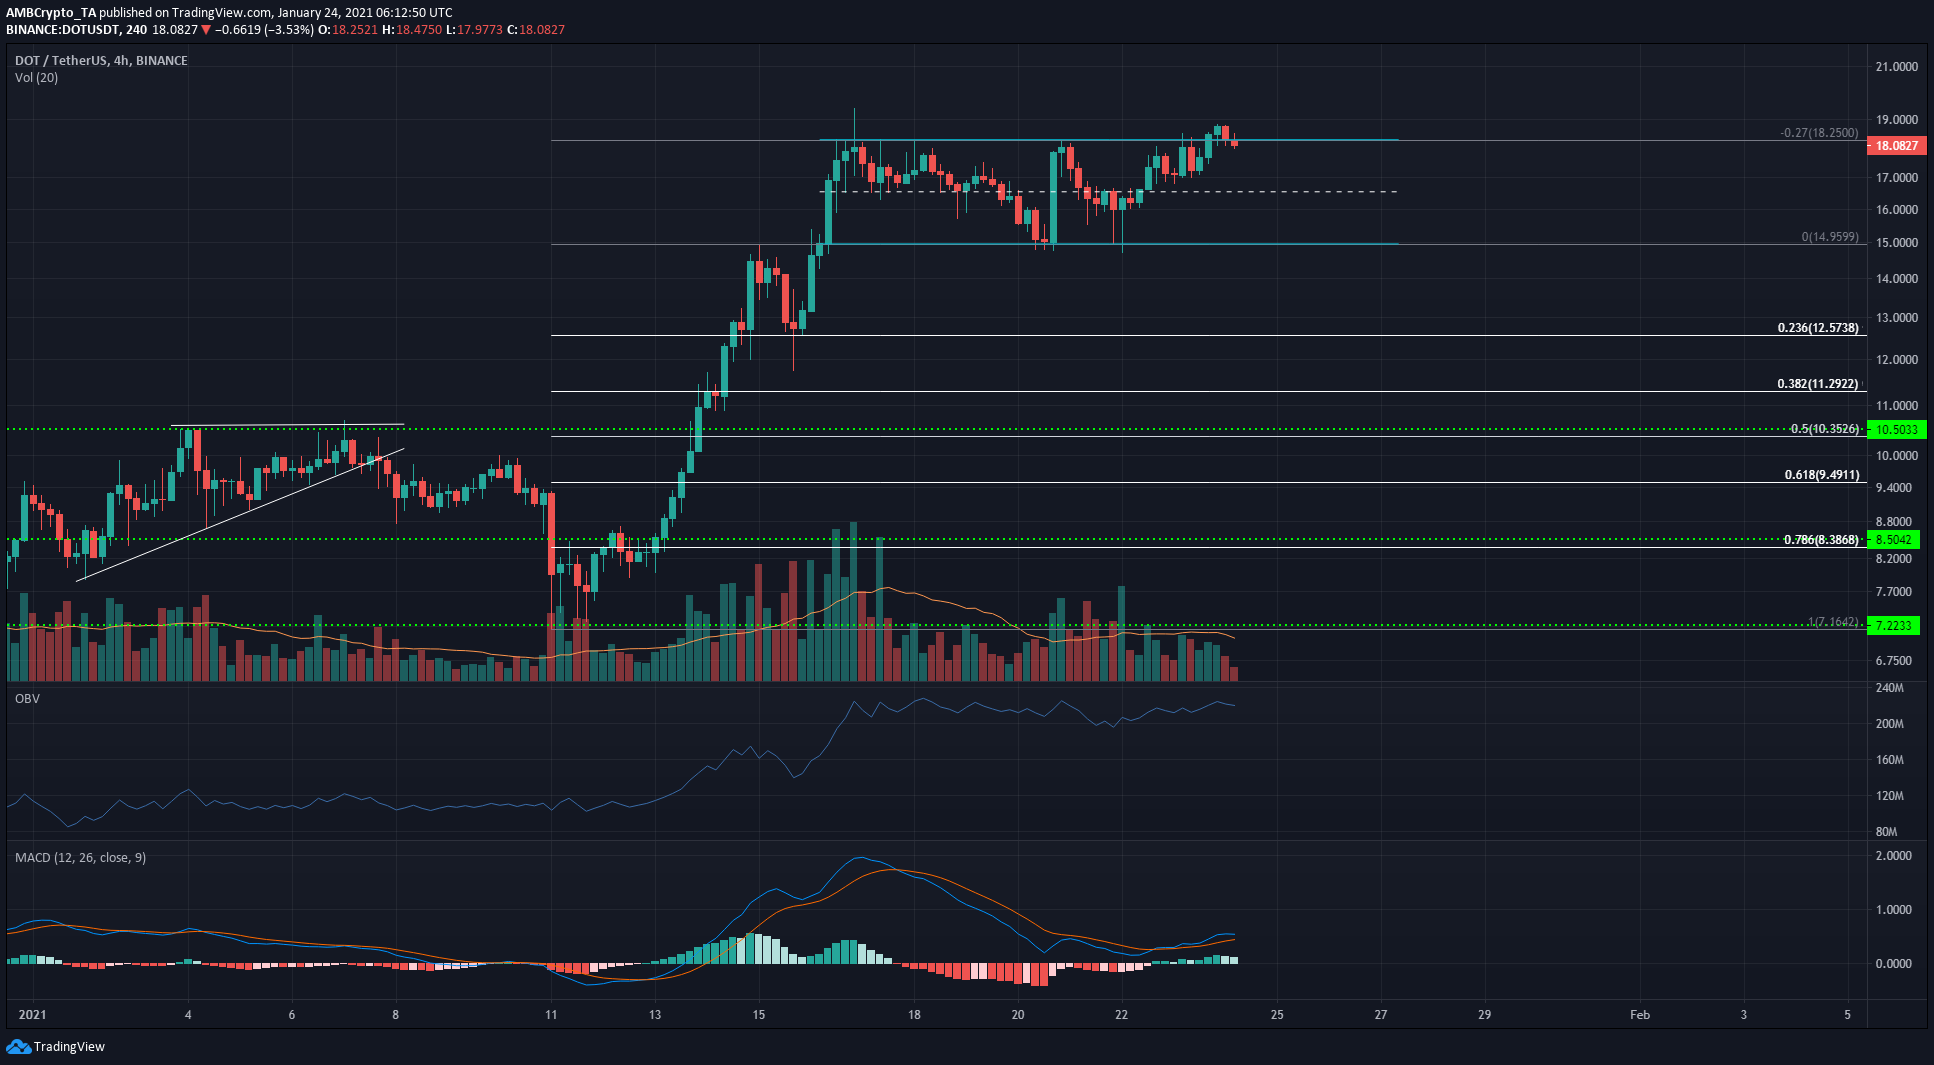
DOT was trading within the range from $14.95 to $18.25. It saw a trading session close above it at $18.74 but the price was pushed back beneath the upper boundary over the past few hours.
The OBV showed that there was an equilibrium between buying and selling volume over the past ten days. The MACD also hinted that the past couple of days saw neutral to slightly bullish momentum for DOT. During the same period, trading volume has also been subdued.
Failure to break past the range highs would likely see DOT approach the mid-point of the range at $16.5 over the next few days.
Dash [DASH]
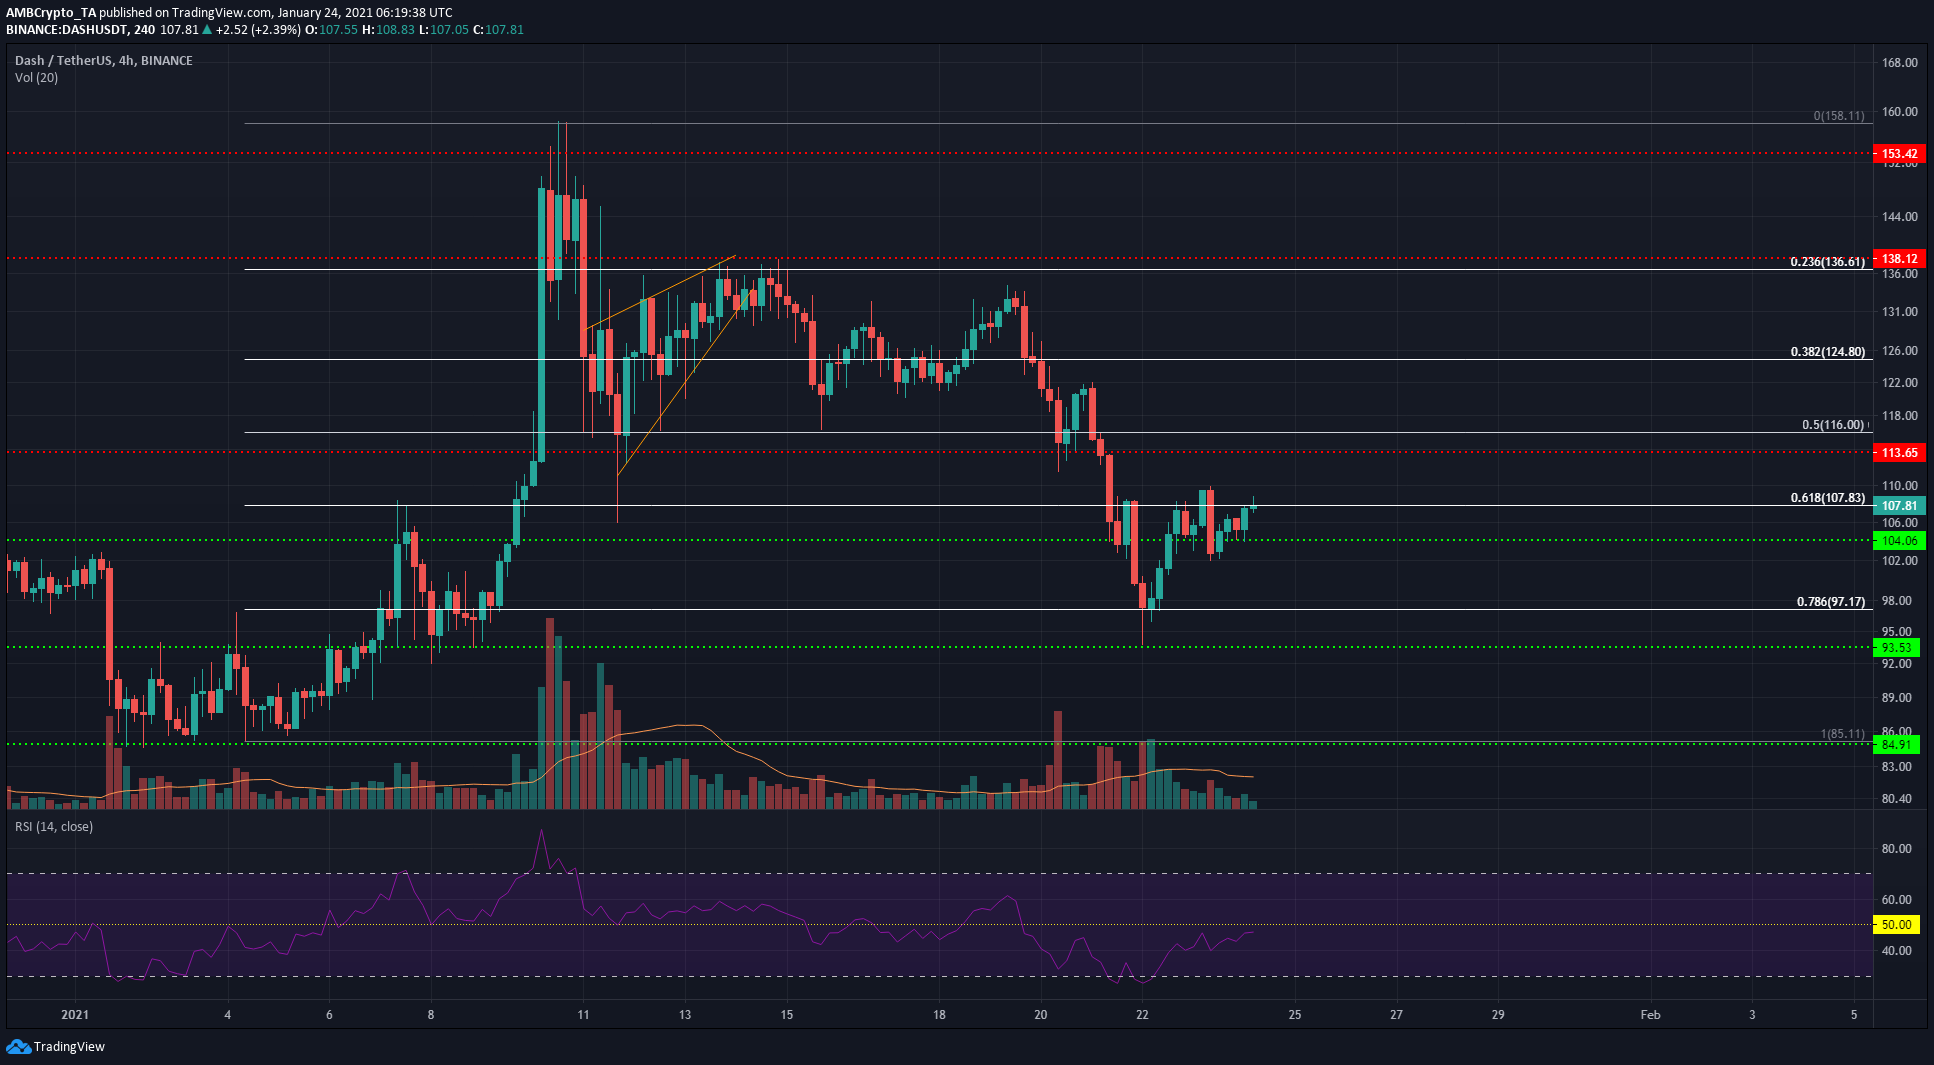
Since posting the highs of $158 two weeks ago, Dash has been in a downtrend. The longest duration of a bounce in this time period was close to four days. The current bounce for DASH – off the $93 support level, saw the price rise to the 61.8% retracement level at $107.
If this bounce lasts longer than four days, it can be considered to be a possible recovery. If it drops before, then it will be confirmed to have been a bounce.
The $107 and $113 levels represent imminent levels of resistance. The RSI was below neutral 50 and showed that the downtrend was not yet broken.
Uniswap [UNI]
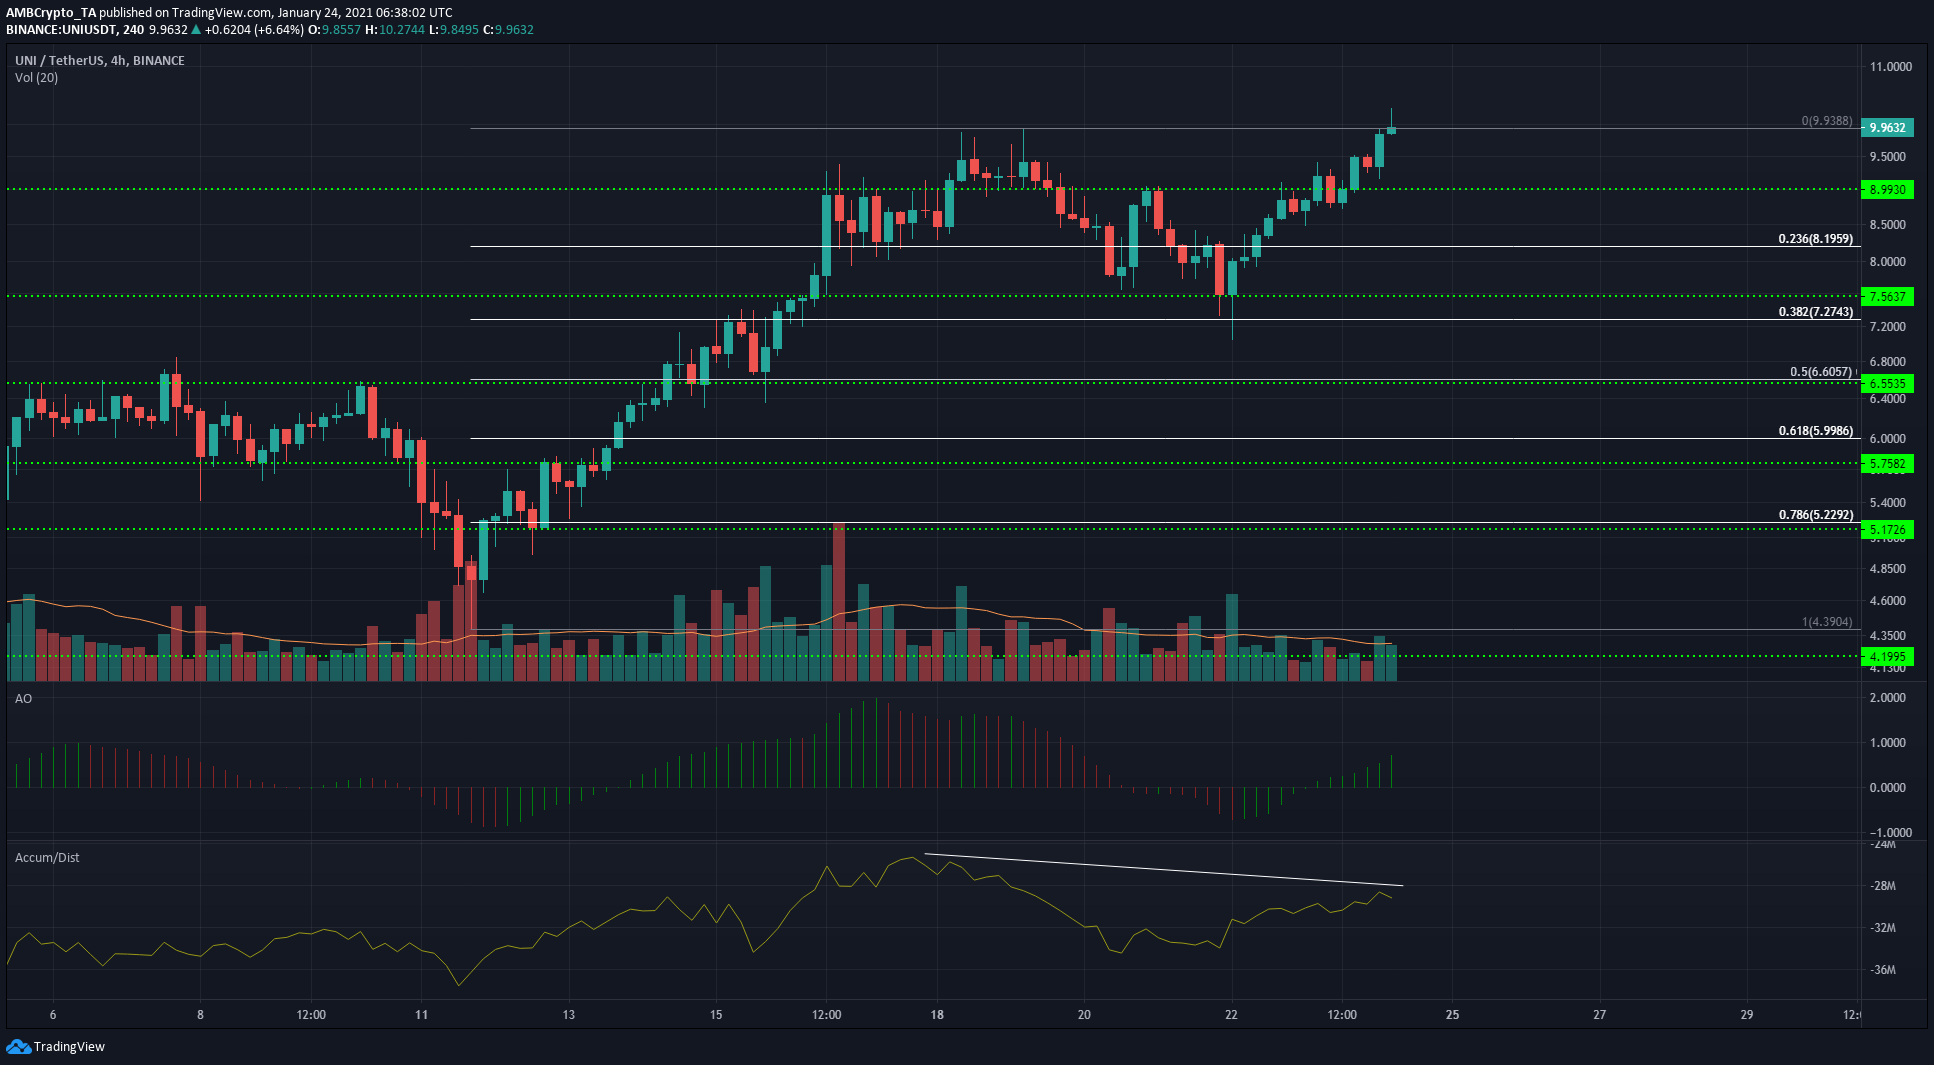
Using the swing low and previous swing high at $4.39 and $9.93 respectively, Fibonacci retracement levels were drawn to plot levels of support. The price dropped to the 38.2% retracement level and found support in its vicinity.
A breakout past $9.4 projected a target of $12.39 for UNI, which is the 27% extension of its upward move from $4.39.
The Awesome Oscillator showed mounting bullish momentum, but the A/D indicator showed a bearish divergence as the price made a higher high while the A/D formed a lower high. A pullback is not confirmed, but $9 and $8.2 can offer buying opportunities if UNI sees a drop.


