Polkadot [DOT] can witness some upside thanks to this upgrade

Polkadot [DOT] developers recently launched a new network upgrade to modify the Polkadot Runtime to v9270. After the upgrade was launched, DOT’s price corresponded and started gaining upward momentum.
DOT recently witnessed a plunge in its price as it went to as low as $6.7 on 7 September. However, the recovery has been quick. At press time, DOT was trading at $7.64, registering 6.42% 24-hour gains with a market capitalization of $8,515,538,465.
What’s working in favor of DOT?
Recently, DOT’s hourly social volume skyrocketed as it surged by more than 100%. This is a positive signal as it indicates increased interest of investors and traders in the token.
Furthermore, the altcoin has also been performing well in the last few days. Additionally, the development of happening in the blockchain also gave it the push to increase its social dominance.
📈 #cryptocurrency Hourly Social Volume Increased by 100.0% for $DOT Current price: $7.39 DOT is available here: https://t.co/ObLTn2l28E
— CoinPump.info (@CoinPumpInfo) September 9, 2022
Moreover, Bill Laboon, head of education and grants at Web3 Foundation, also mentioned Polkadot in a recent interview with Blockchain.com.
In the interview he said, “Polkadot is basically a meta platform for developing your own blockchain. The idea is that there’s no single solution to solve all problems, so it allows developing blockchains which can be specialized for some specific purposes.”
Ranked #10 by market cap, find out:
🔵 What makes @Polkadot different?
🔵 What's on the roadmap for #Polkadot?With @BillLaboon of the @Web3foundation.
Listen now 👀
Apple: https://t.co/vWybxPvvBq
Spotify: https://t.co/repnExF1rr
Other: https://t.co/jTmFYsMT6V pic.twitter.com/CRd7ng8saI— Blockchain (@blockchain) September 6, 2022
The metrics in play
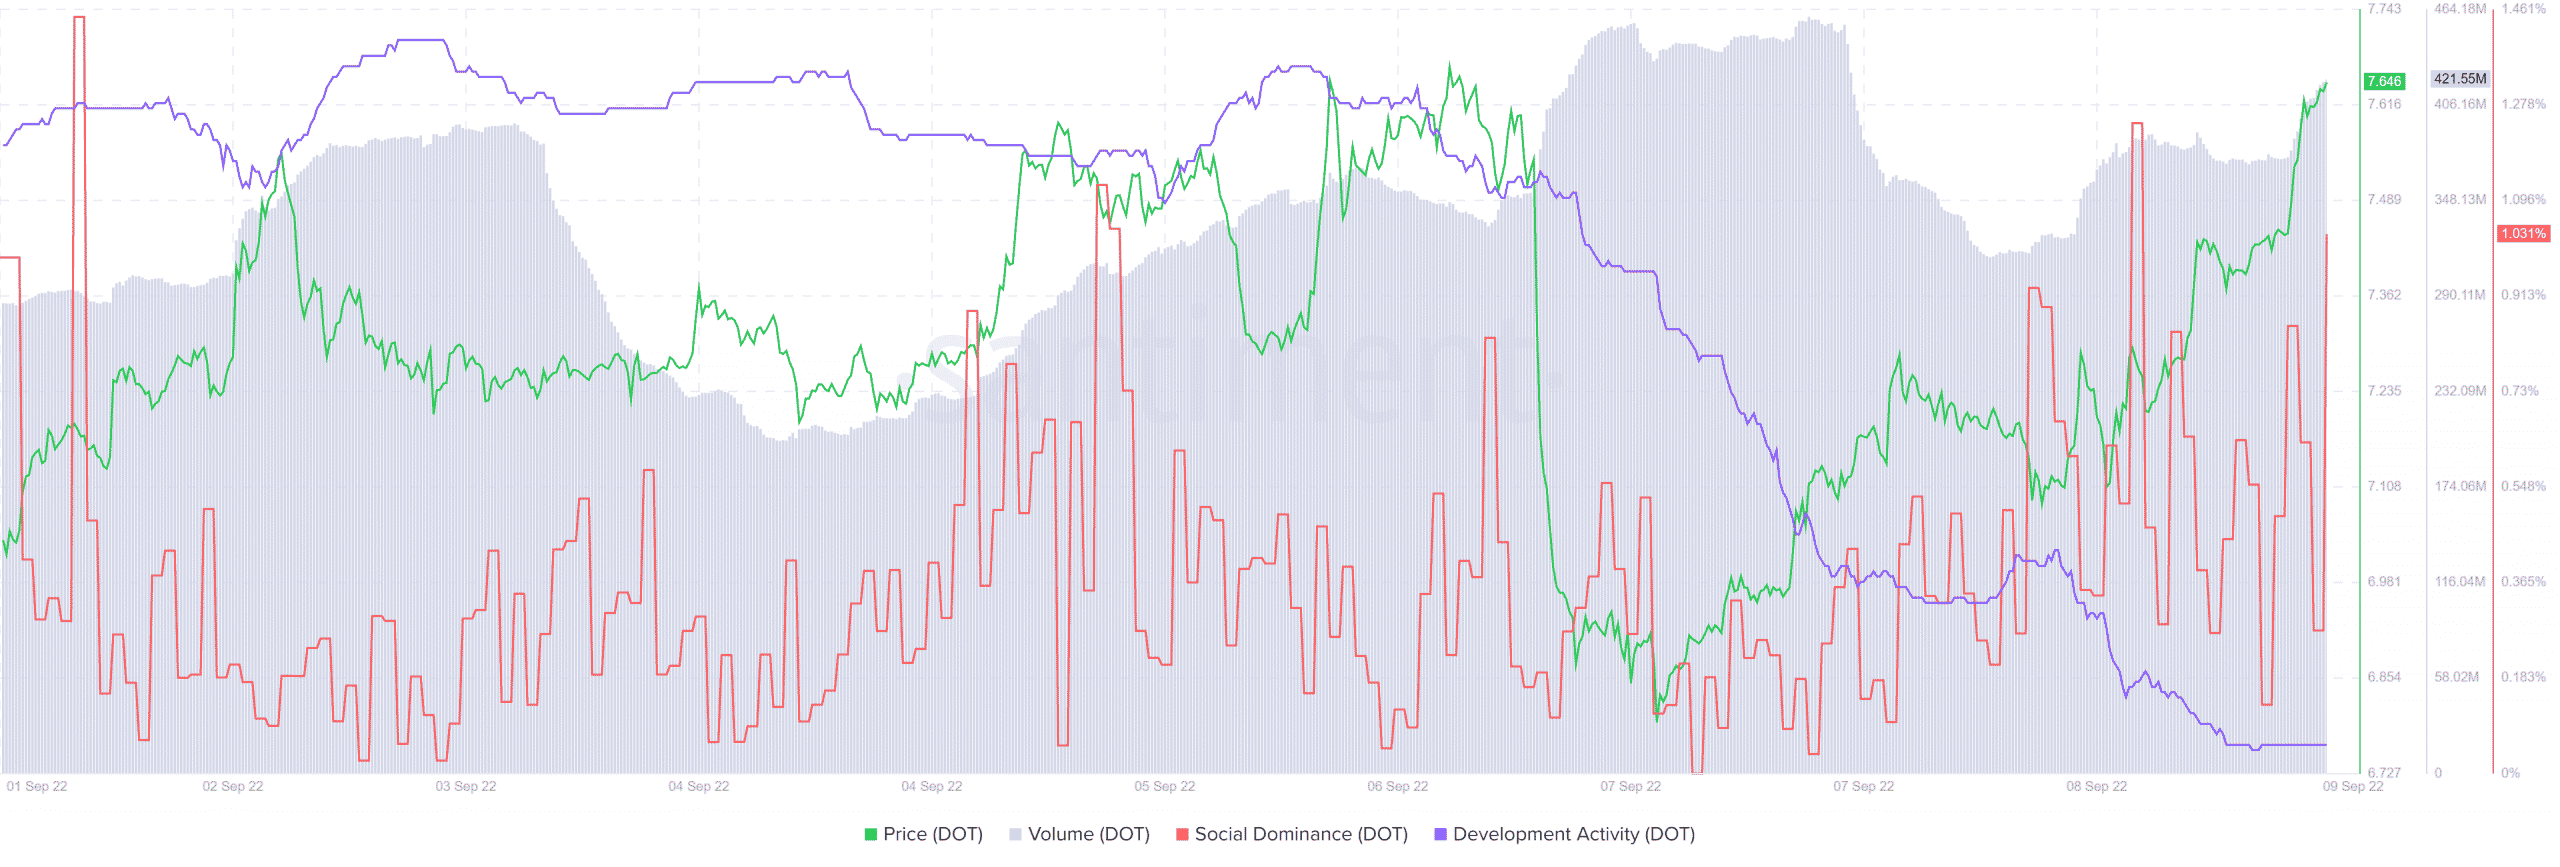
A few metrics also supported the DOT’s recent northbound movement. For instance, DOT’s volume increased in the last two days along with its social dominance.
This indicated that the uptick could be stable in the near future. However, a steep decline was seen in the blockchain’s development activity, which doesn’t compliment the price hike.
Looking forward
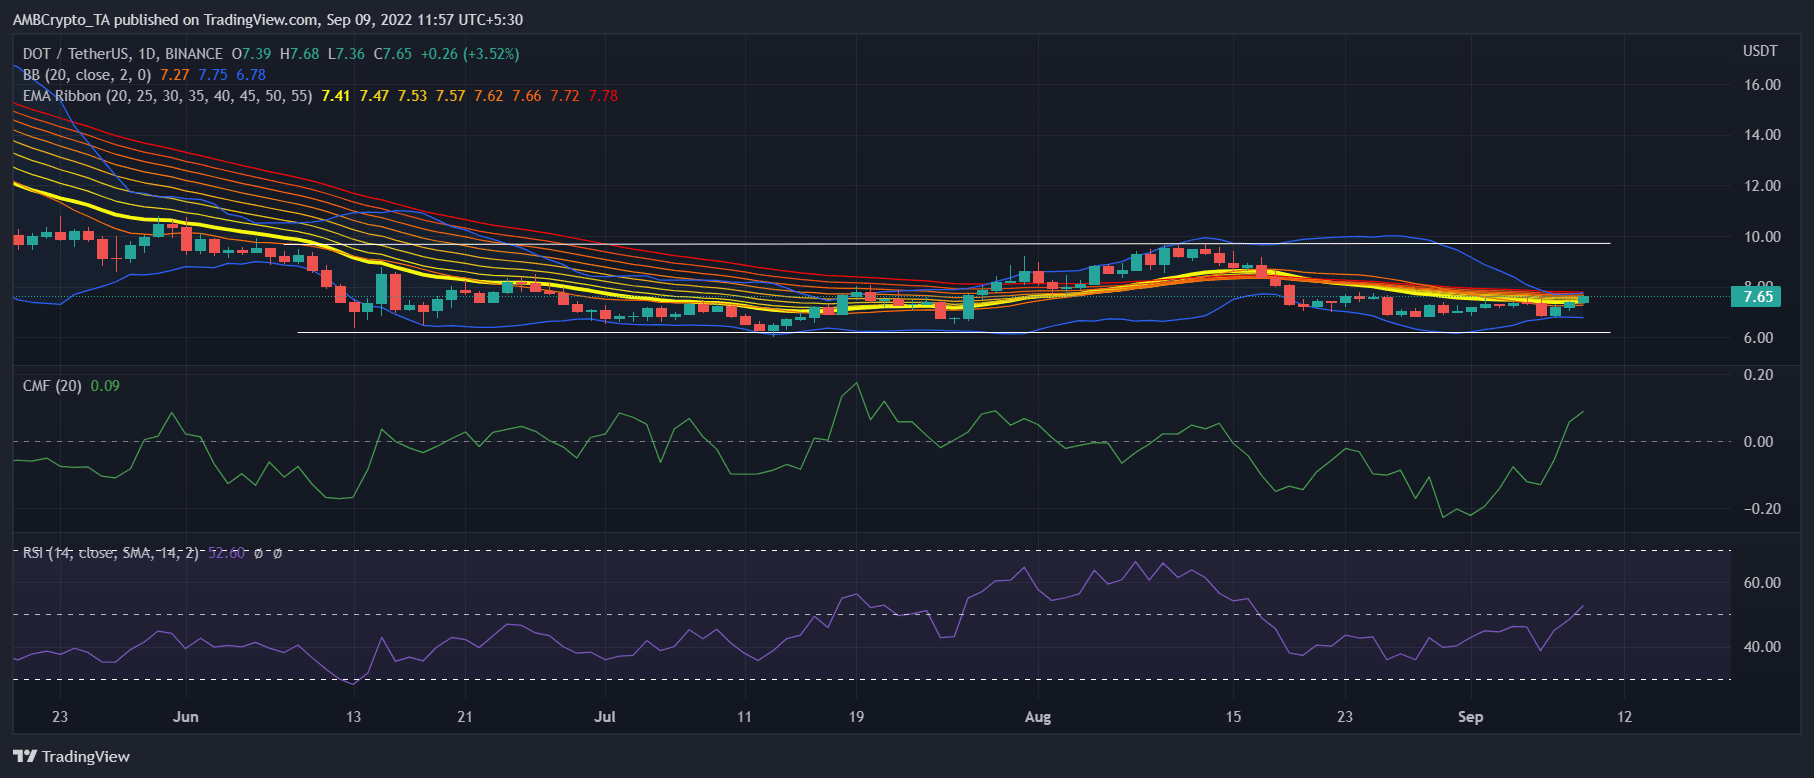
A look at DOT’s daily chart told a promising story as several indicators suggested a northbound breakout in the coming days. The Chaikin Money Flow (CMF) and Relative Strength Index (RSI) registered upticks, indicating a possible price surge soon.
The Exponential Moving Average (EMA) Ribbon also painted a similar picture. This is because thegap between the 20-day and 55-day EMA reduced considerably increasing the chances of a bullish crossover.
Moreover, the Bollinger Bands (BB) also showed that DOT’s price was in a crunched zone. This further increasedthe possibility of a northward breakout.