Polkadot, EOS, VeChain Price Analysis: 05 February

Polkadot held steady above $20 as technicals suggested a target of $23.6 for DOT bulls to achieve over the coming days. EOS was in a phase of consolidation just above an important level of support at $3. VeChain was trading above the $0.028 level of support but showed a lack of short-term momentum.
Polkadot [DOT]
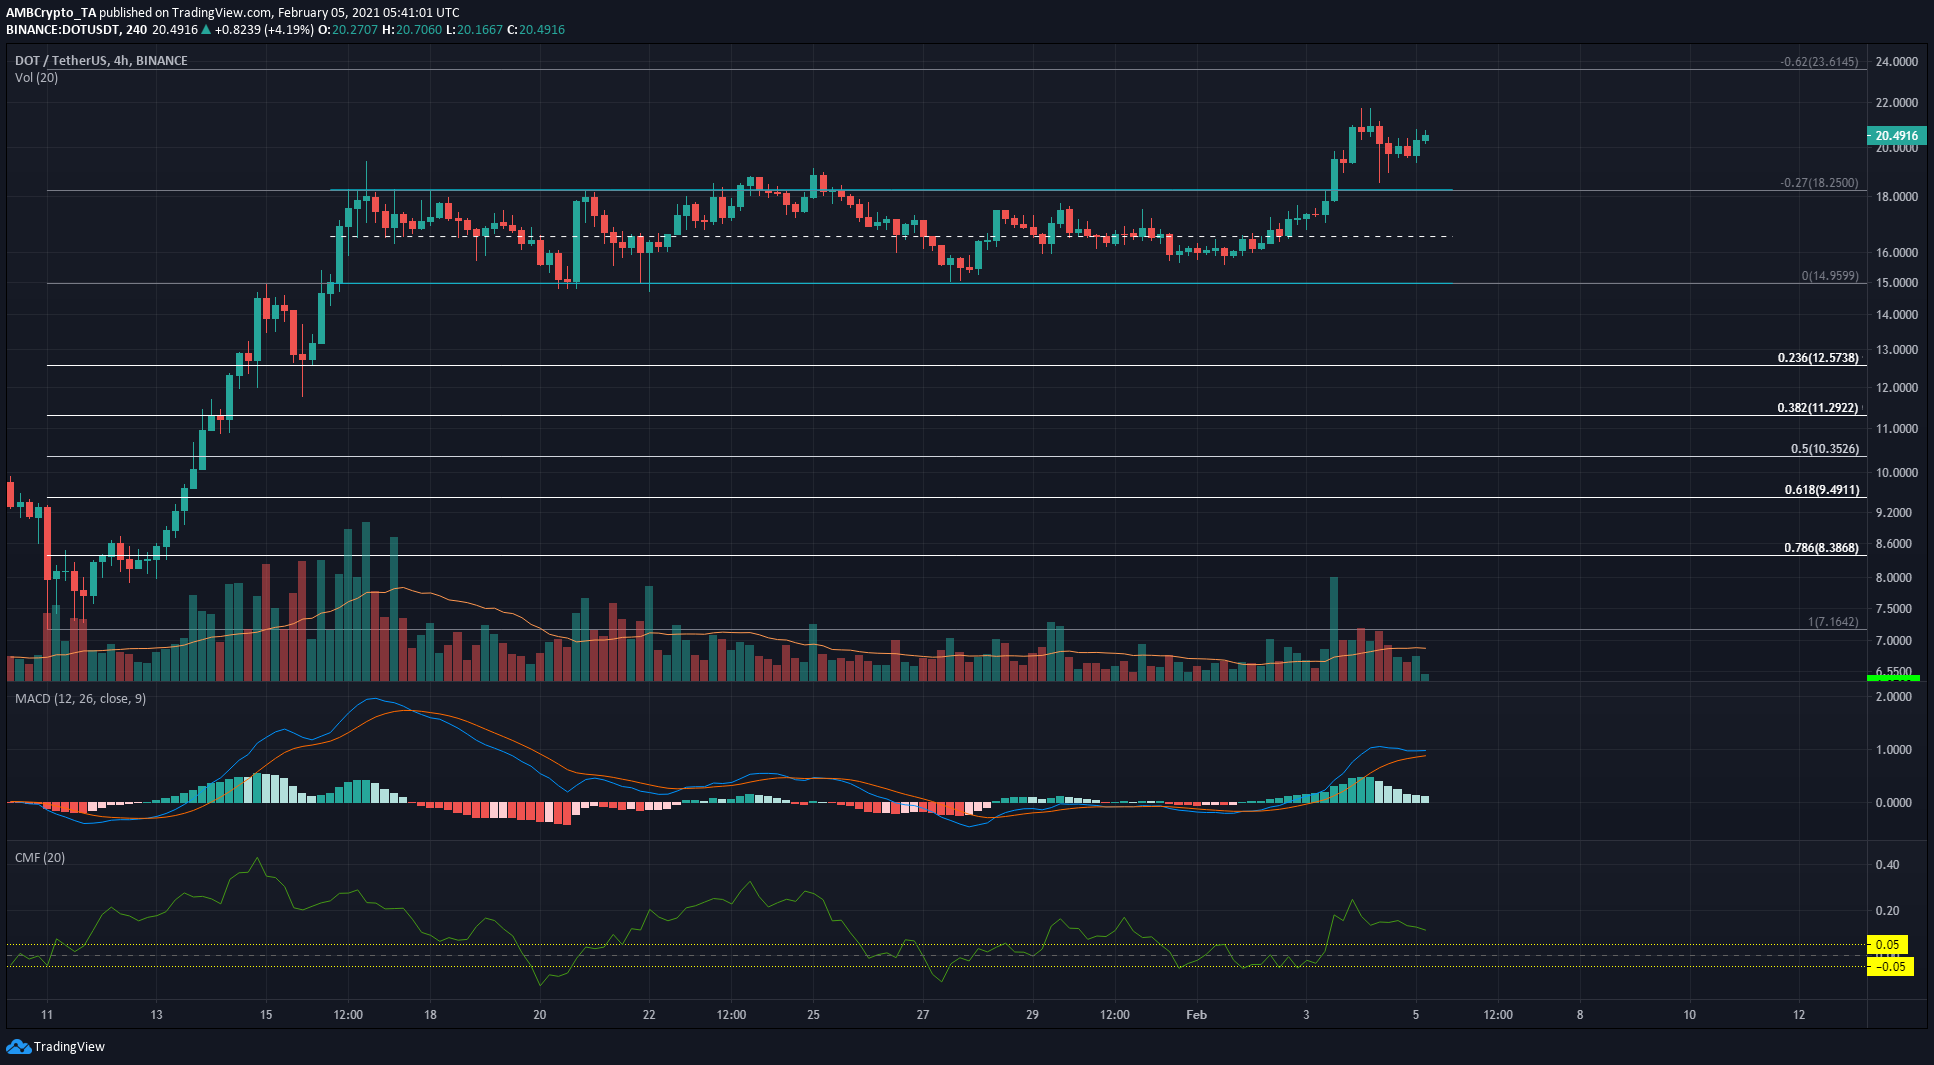
DOT broke out of the range it was trading within and rose above $20. The past couple of days saw DOT fall to near the range highs but buyers were quick to push the price back up.
The CMF was above +0.05 to show net capital inflow into the market. The MACD also gave a strong buy signal. The Fibonacci 62% extension level presented a bullish target of $23.6 for DOT over the next few days.
In the event that DOT sees another minor dip, the $19.5-$20 region can once more be expected to serve as strong support.
EOS
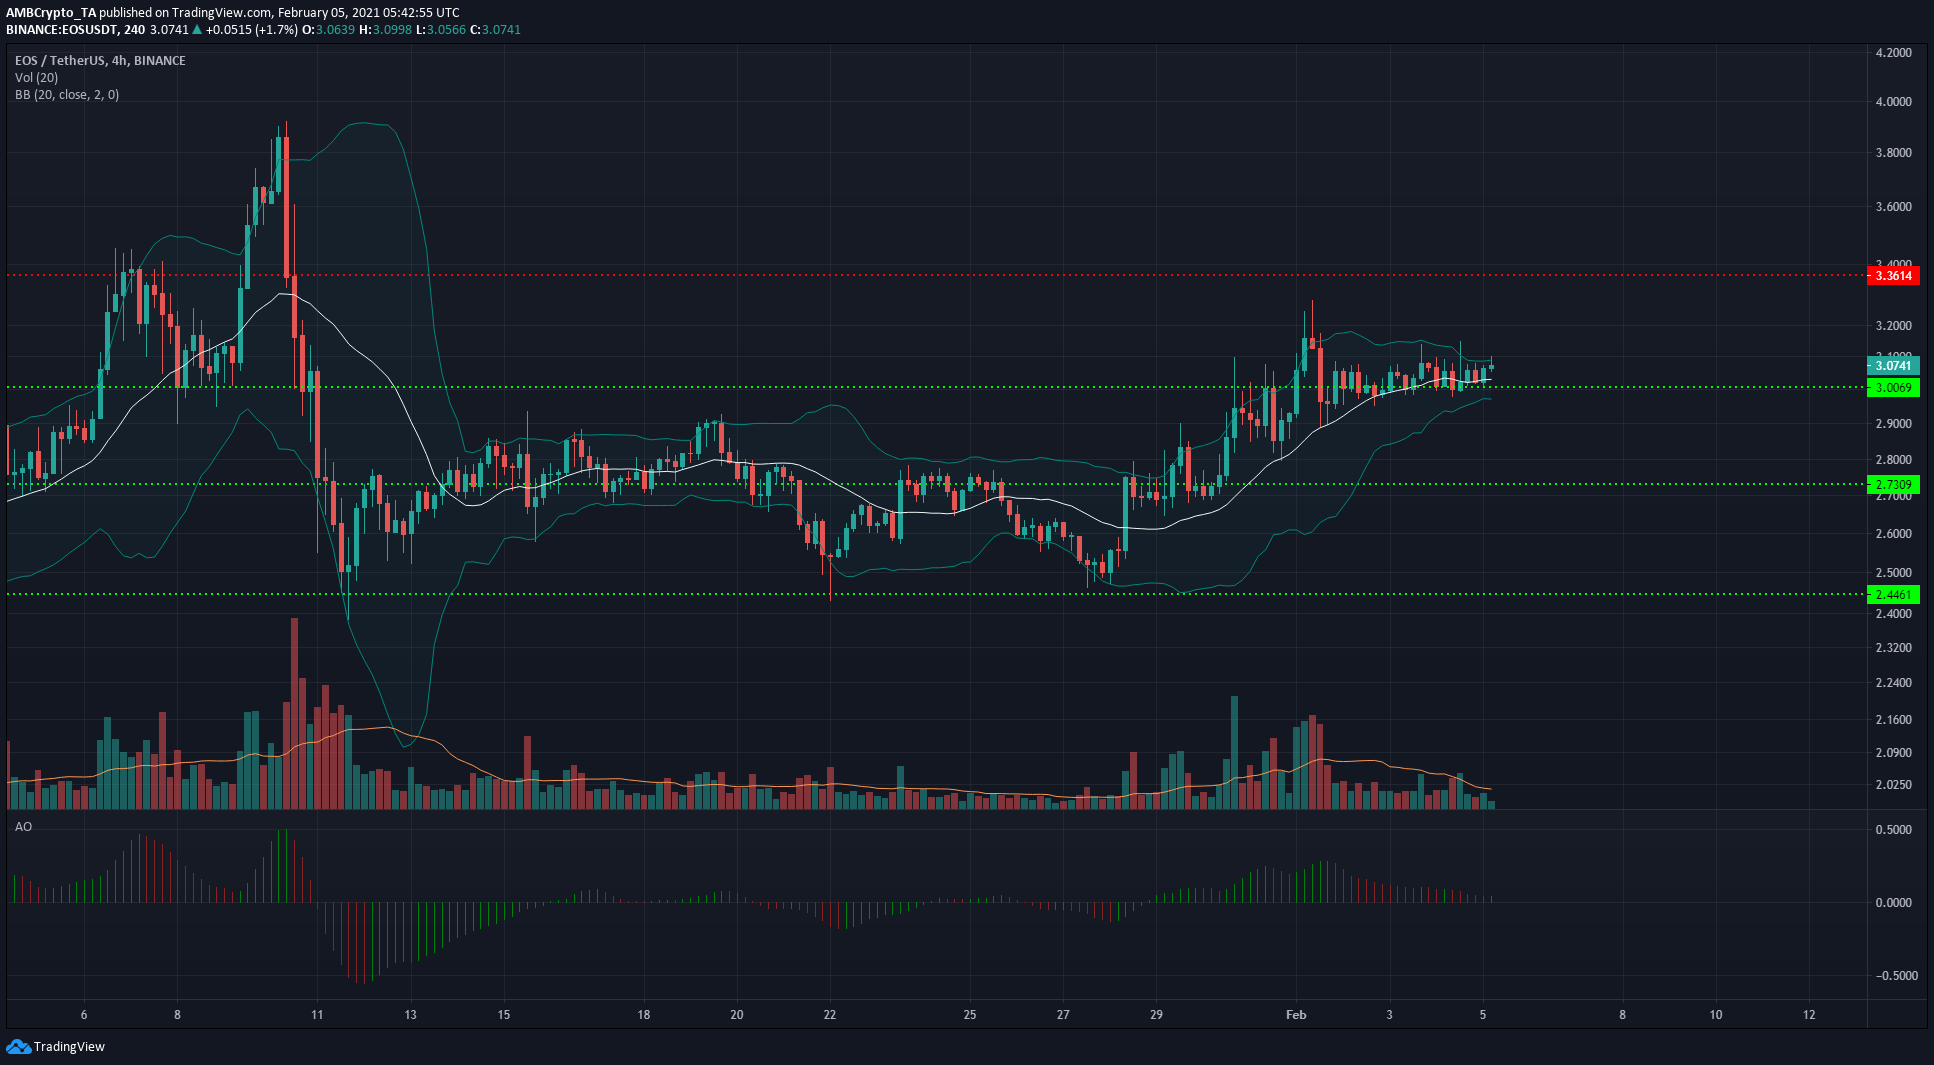
EOS rose above the $3 level and entered a phase of consolidation. Trading volume dropped and the Bollinger bands tightened around the price to indicate lowered volatility.
The Awesome Oscillator also showed that the previous rally’s bullish momentum was waning.
Considering that EOS defended the $2.44 level thrice in January before climbing to $3, the next move for EOS could be upward after a period of consolidation.
VeChain [VET]
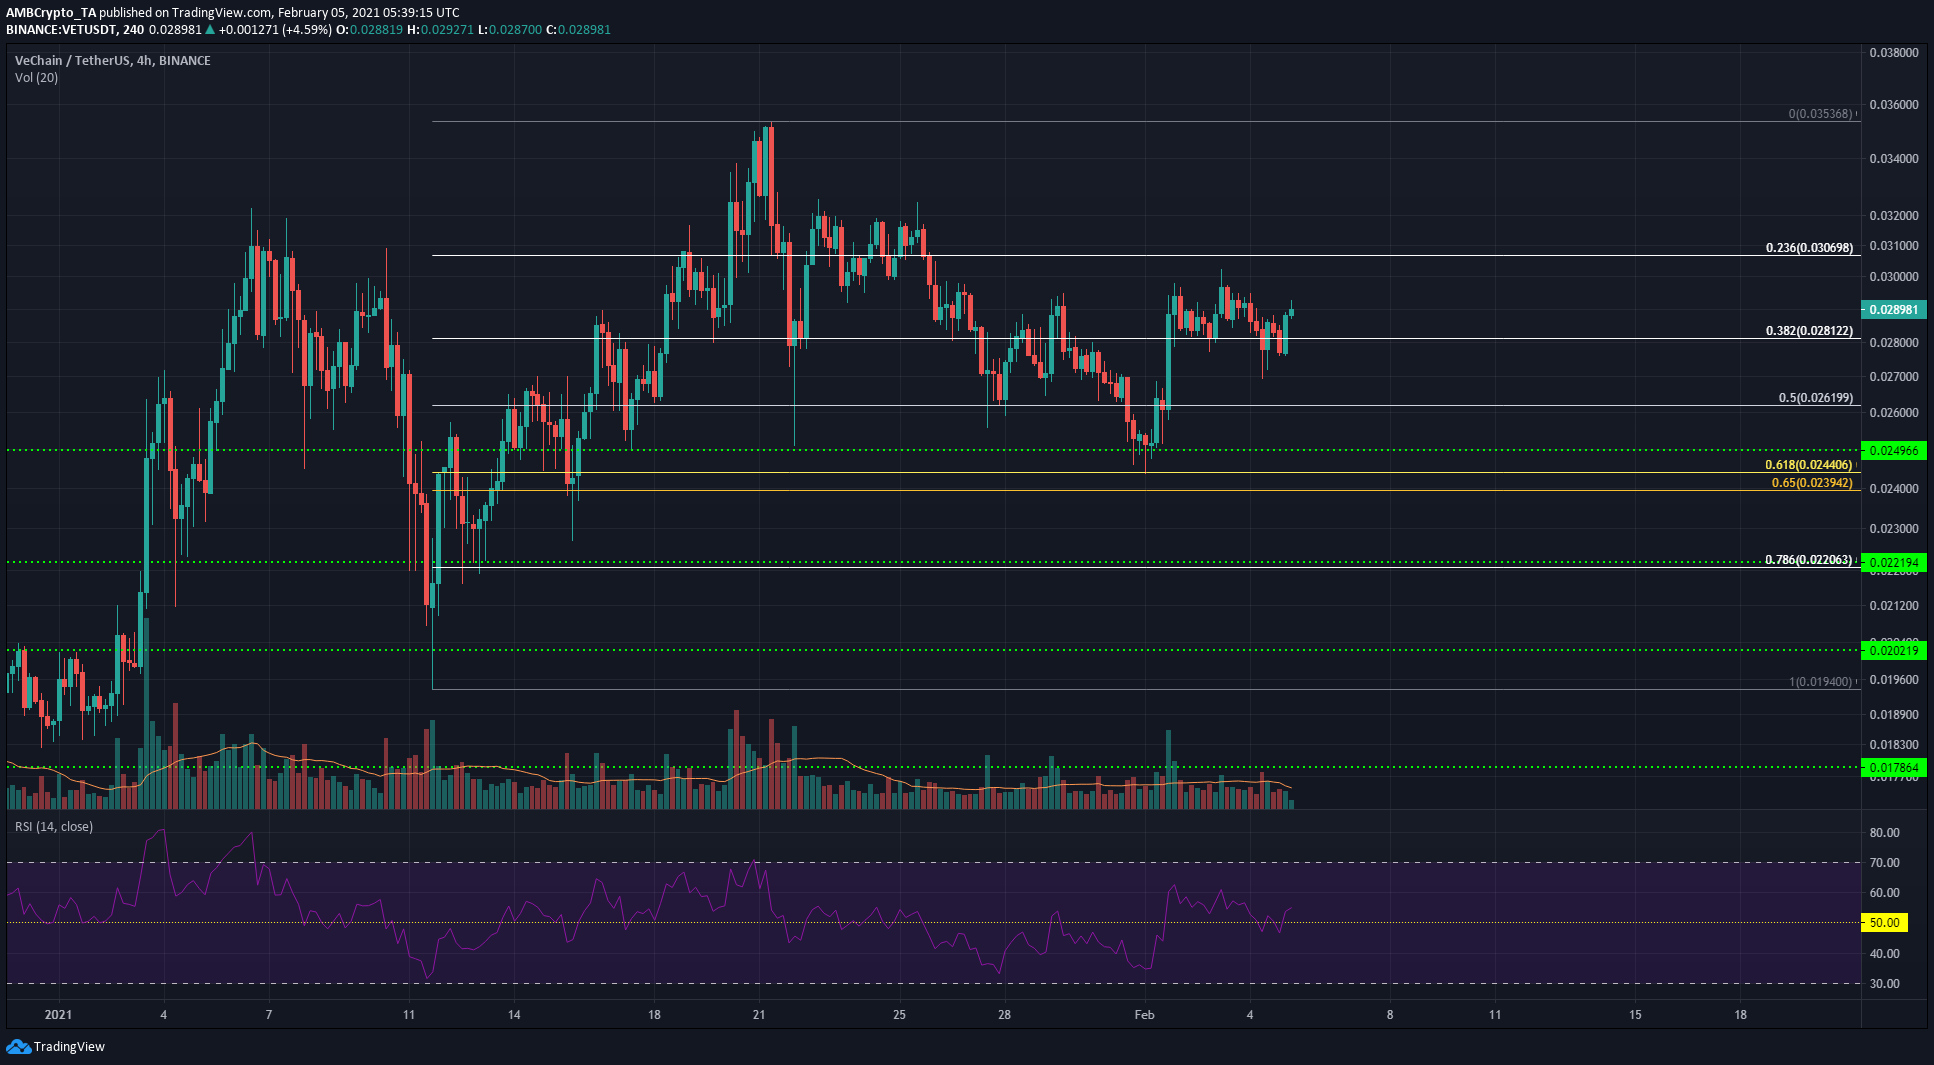
VeChain surged from $0.02 to $0.035 in mid-January but was forced to retrace some of those gains over the subsequent two weeks.
The Fibonacci retracement tool for this move shows the 61.8% level at $0.0244, with VET seeing a candlewick visit this level on its retracement. But since then, VET rose above the 50% level to show it was on the way to recovery and at the time of recovery was trading above the 38.2% level.
The RSI oscillated about neutral 50 to show some short-term lack of momentum.