Polkadot flips demand zone to resistance, what’s next for DOT on the charts

Disclaimer: The information presented does not constitute financial, investment, trading, or other types of advice and is solely the writer’s opinion
- The bullish order block was flipped to a bearish breaker
- The higher timeframe market structure was bearish after the move below $5.73 recently
Polkadot fell right beneath the $6.3 region of support on 9 November in the aftermath of widespread panic following the FTX saga. Bitcoin was also below the $17k mark, with bearish targets being as low as $14.8k and $13.2k. It appeared likely that DOT would see further losses in November.
Read Polkadot’s [DOT] Price Prediction in 2022-2023
A recent article highlighted that a bullish order block had formed on the daily chart at $6.3. However, since then, this region was blown apart by selling pressure and had been flipped to a bearish breaker.
The retest of the former bullish order block as a bearish breaker could offer shorting opportunities
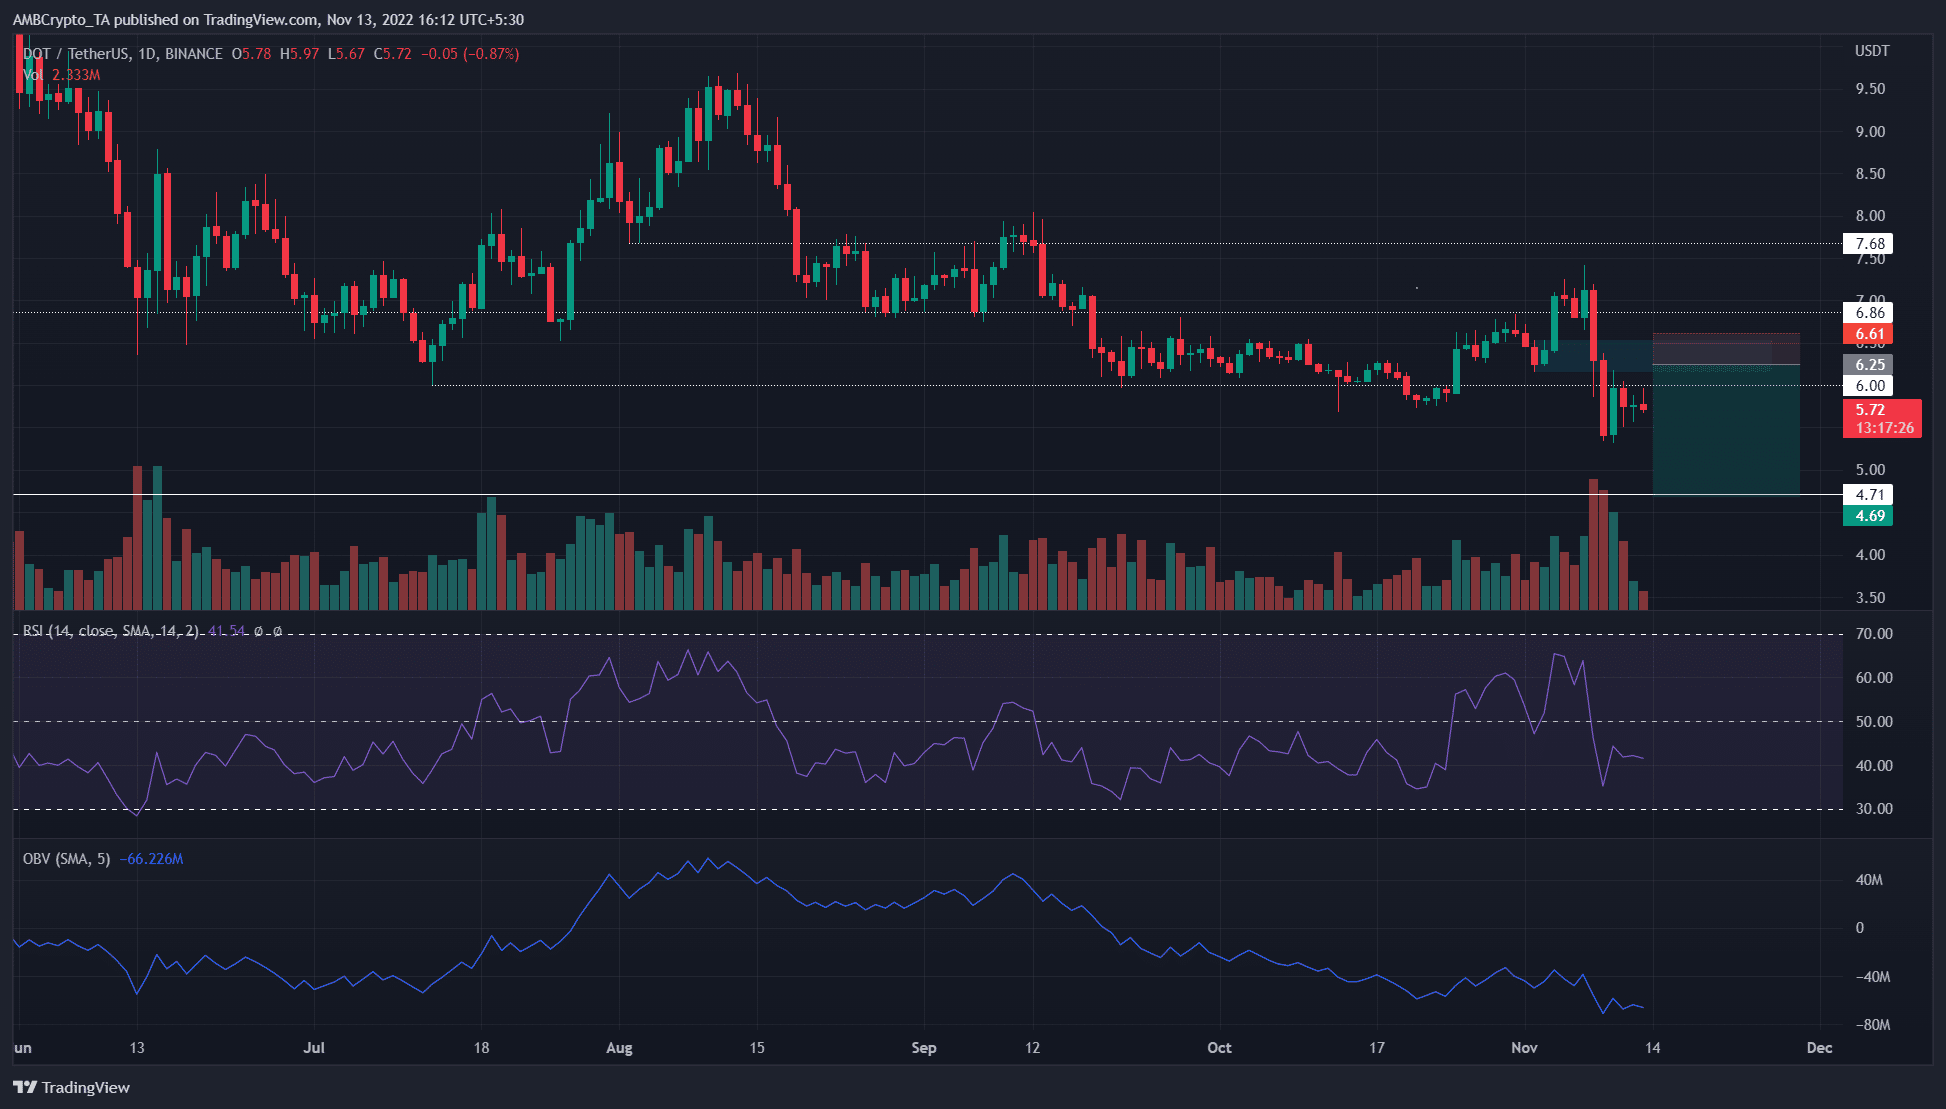
On 2 November, Polkadot saw a red trading day on the charts. This was followed by a reversal to the north that reached as high as $7.4. Since this move flipped the structure in favor of the bulls at that time, it was a bullish order block. It was expected that the same region would see a positive reaction upon a retest.
This did not happen. Instead, the price crashed right through this area, pausing for a few hours at the $6.2 mark on 9 November before plunging to $5.34.
The Relative Strength Index (RSI) had fought valiantly to stay above neutral 50 earlier this month but finally gave way to the selling pressure. The On-Balance Volume (OBV) was also on a downtrend since September. The attempts by the buyers to reverse this trend in early November were a failure.
Further lower on the charts, a level of support was seen at $4.71. It had last been tested as a support level in December 2020 and can serve as a take-profit target for the bears. Invalidation of this bearish notion would be a daily session close above the bearish breaker, at $6.53 or higher.
Development activity was high and NFT trades were down
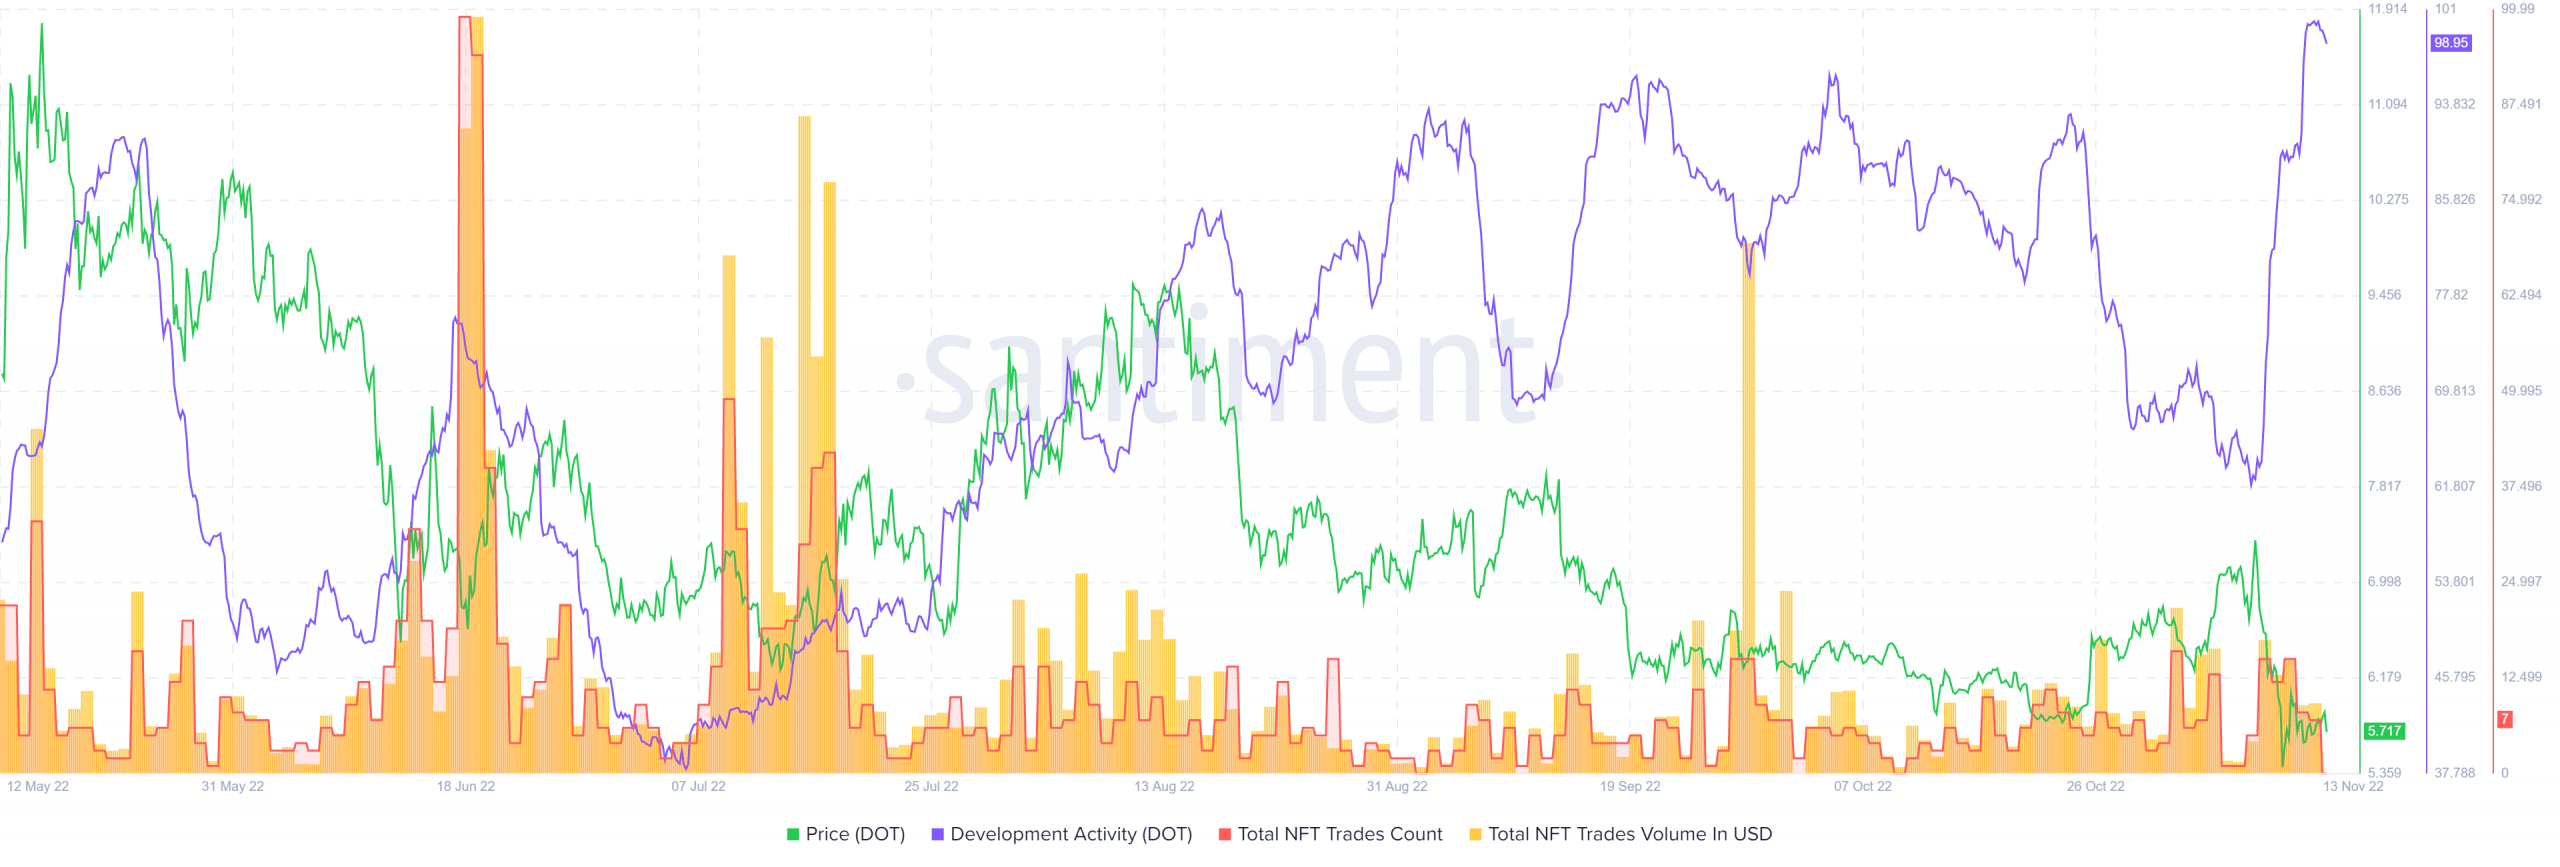
In the midst of all the carnage in the crypto markets, the developers behind Polkadot plied their craft ceaselessly. This can be a positive sign for long-term investors. That does not mean buyers can begin to buy DOT immediately, however.
As for NFT trades, both the count of the trades as well as the trade volume has been down since July. Surges like those in late September and late October were few and far in between.
Traders looking to sell DOT can wait for a favorable entry near $6.3, while those already in short positions can look to take profit as DOT approached $4.7. It was also possible that DOT could go lower, especially if Bitcoin decided to sink to $14k or lower.