Polkadot, Monero, VeChain Price Analysis: 07 July

Most altcoins in the market, at press time, continued to move within predictable price ranges without giving any clear buy signals. Polkadot, after a long time, inched above its crucial resistance level of $16.70. Monero gained by 3.4% in 24 hours amidst the news of the Kaseya Ransomware Attack. Finally, VET registered minor buying pressure on the price charts.
Polkadot [DOT]

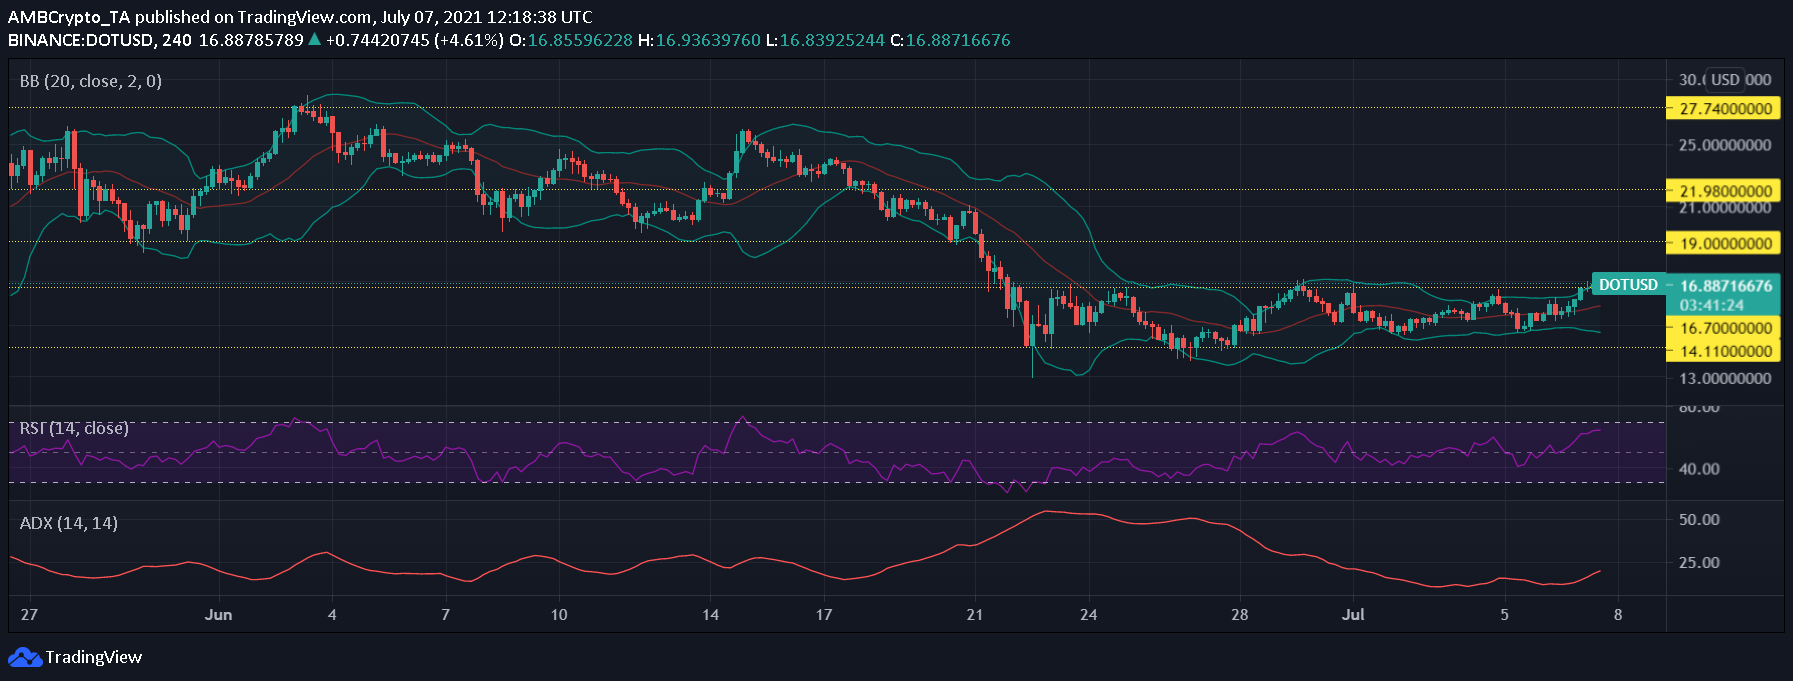
DOT/USD, TradingView
DOT had been trading within a tight range of $14.11 and $16.70. However, at the time of writing, the alt had risen above the resistance level of $16.70 as it was available for $16.76. The asset’s price noted a hike of 5% over the last 24 hours. What’s more, buying pressure increased too and that might be the reason why the price hiked.
The Relative Strength Index pictured a positive change in buying pressure as the indicator moved up north.
The Average Directional Index underlined a trendless price movement for the alt as the indictor remained just below the 20-mark. Over the last 24 hours, the indicator rose slightly, and if the uptrend sustains itself, the indicator might go above the 20-mark soon.
The Bollinger Bands opened up at press time, suggesting that market volatility might see a hike in the short term.
Monero [XMR]

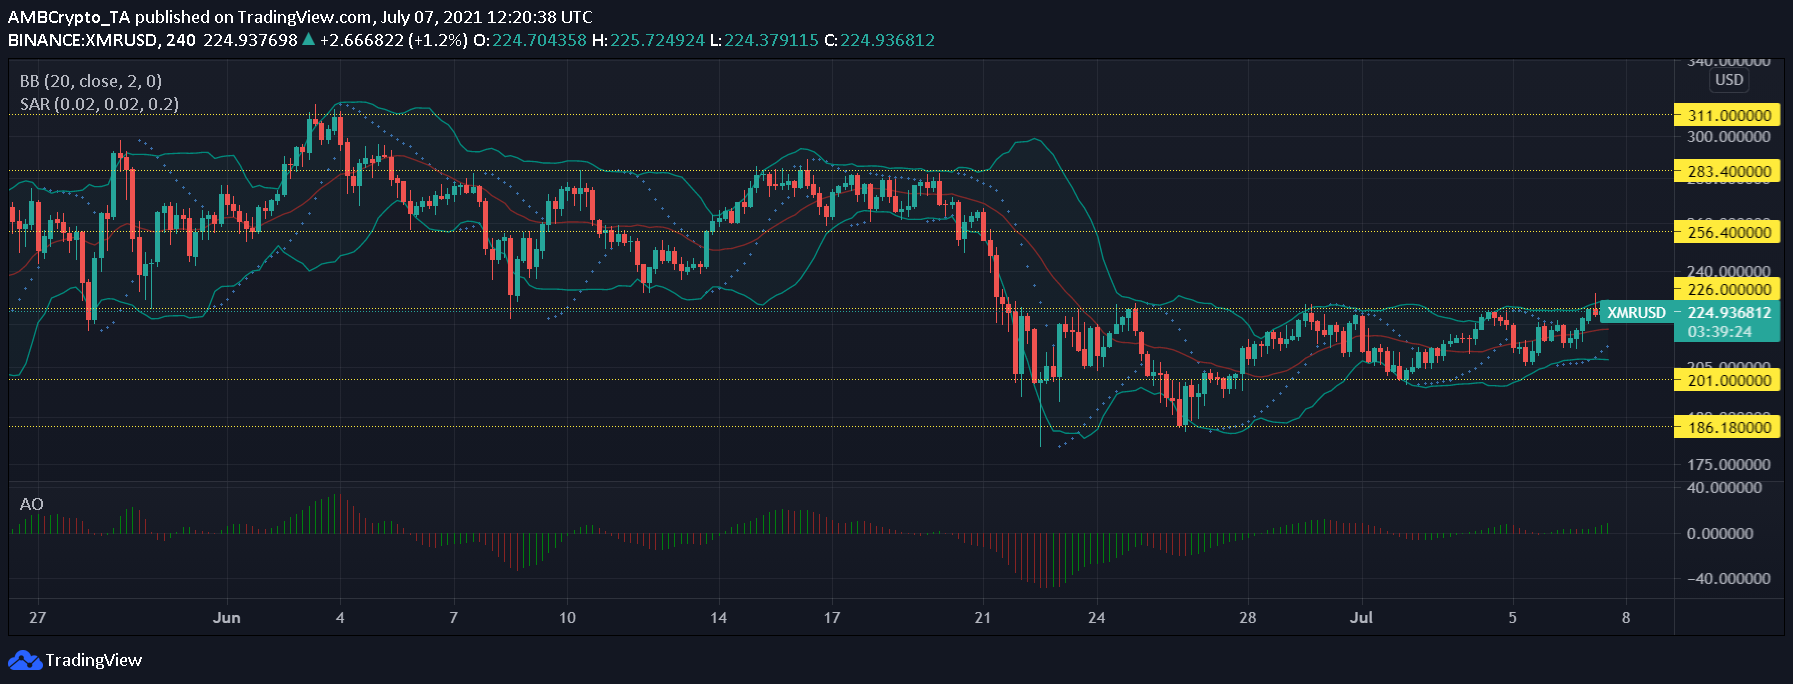
XMR/USD, TradingView
At the time of writing, XMR was valued at a price level of $224.93 after gaining by 3.4% in 24 hours. The market condition of the altcoin was neutral, with mostly lateral movement registered on the technical analysis charts. The digital asset, however, has been rising. So, bullish momentum could take over the market if the crypto continues to maintain its uptrend.
In accordance with the aforementioned statement about the bullish signal, the Awesome Oscillator detected the onset of bullish momentum with the presence of green signal bars. The Bollinger Bands observed some divergence, so price action could see some volatility over the next few trading sessions.
The Parabolic SAR’s dotted lines were seen below the candlesticks and pointed to a price uptrend.
VeChain [VET]

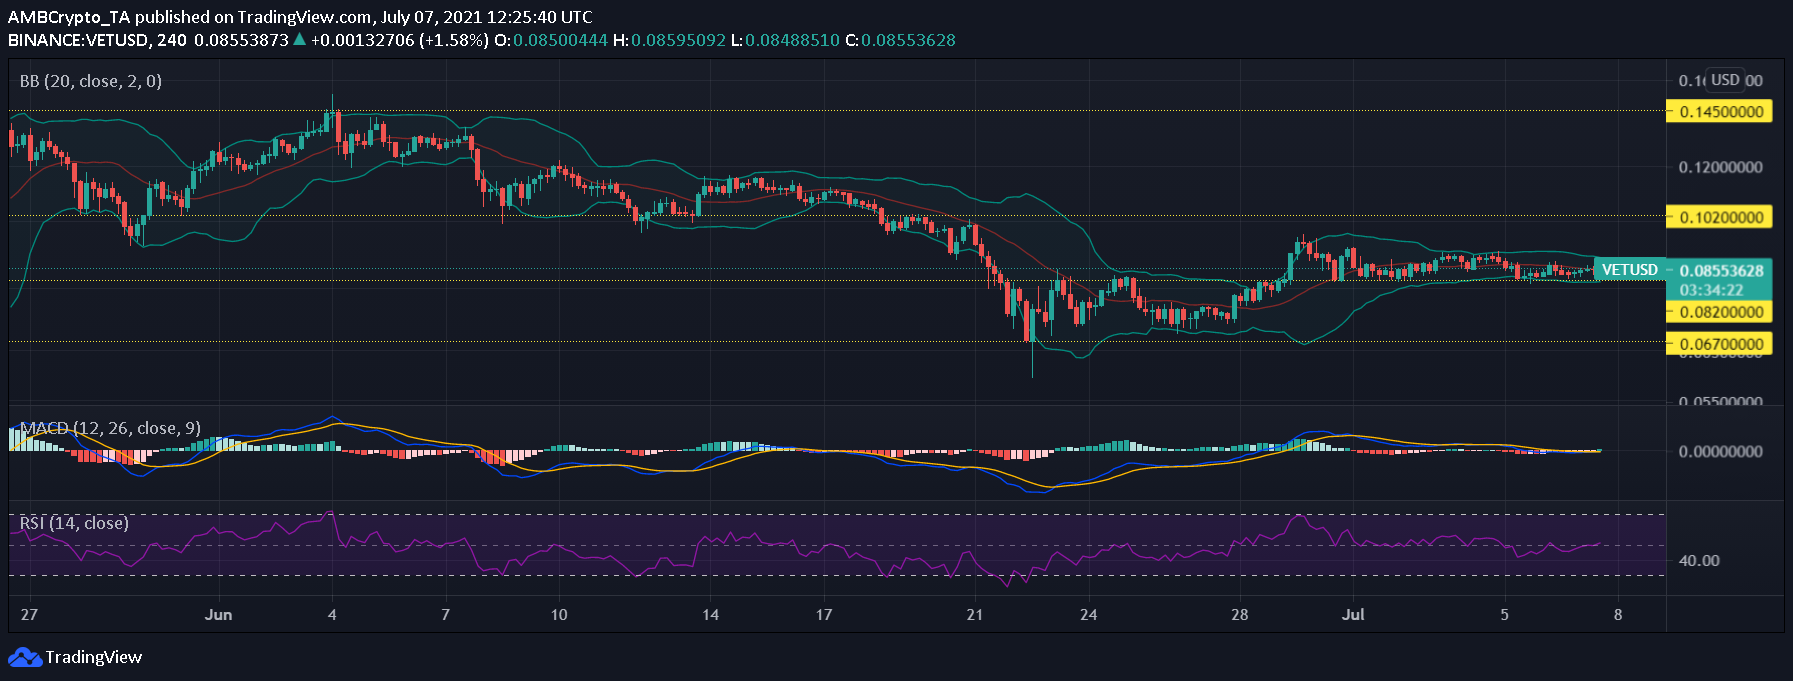
VET/USD, TradingView
VET’s price action has been roaming above the crucial support level of $0.082 for the past few days, which, if breached ever so slightly, could fuel the asset’s fall to $0.067. At press time, the asset was worth $0.085 and noted a 0.6% decline in 24 hours. In case the market bulls emerge and push the price up, then the alt’s price would try to test the $0.102 level.
A bullish crossover was seen on 7 July as the MACD indicator pictured the emergence of a short-term bullish signal. After running parallel to the median line, the Relative Strength Index registered a minute uptick, one hinting at more buyers over sellers at press time.
Finally, the Bollinger Bands tightened quite a bit and ran parallel, a sign that volatility is not expected over upcoming trading sessions.


