Polkadot, Ontology, FTX Token Price Analysis: 17 January

Polkadot showed bearish divergence, and while a pullback isn’t mandated, some regions of support can offer good buying opportunities. Ontology was bullish on the charts and was likely to flip the $0.68 level to support, and FTX Token was unable to break past the $9.8 region over the past few days.
Polkadot [DOT]
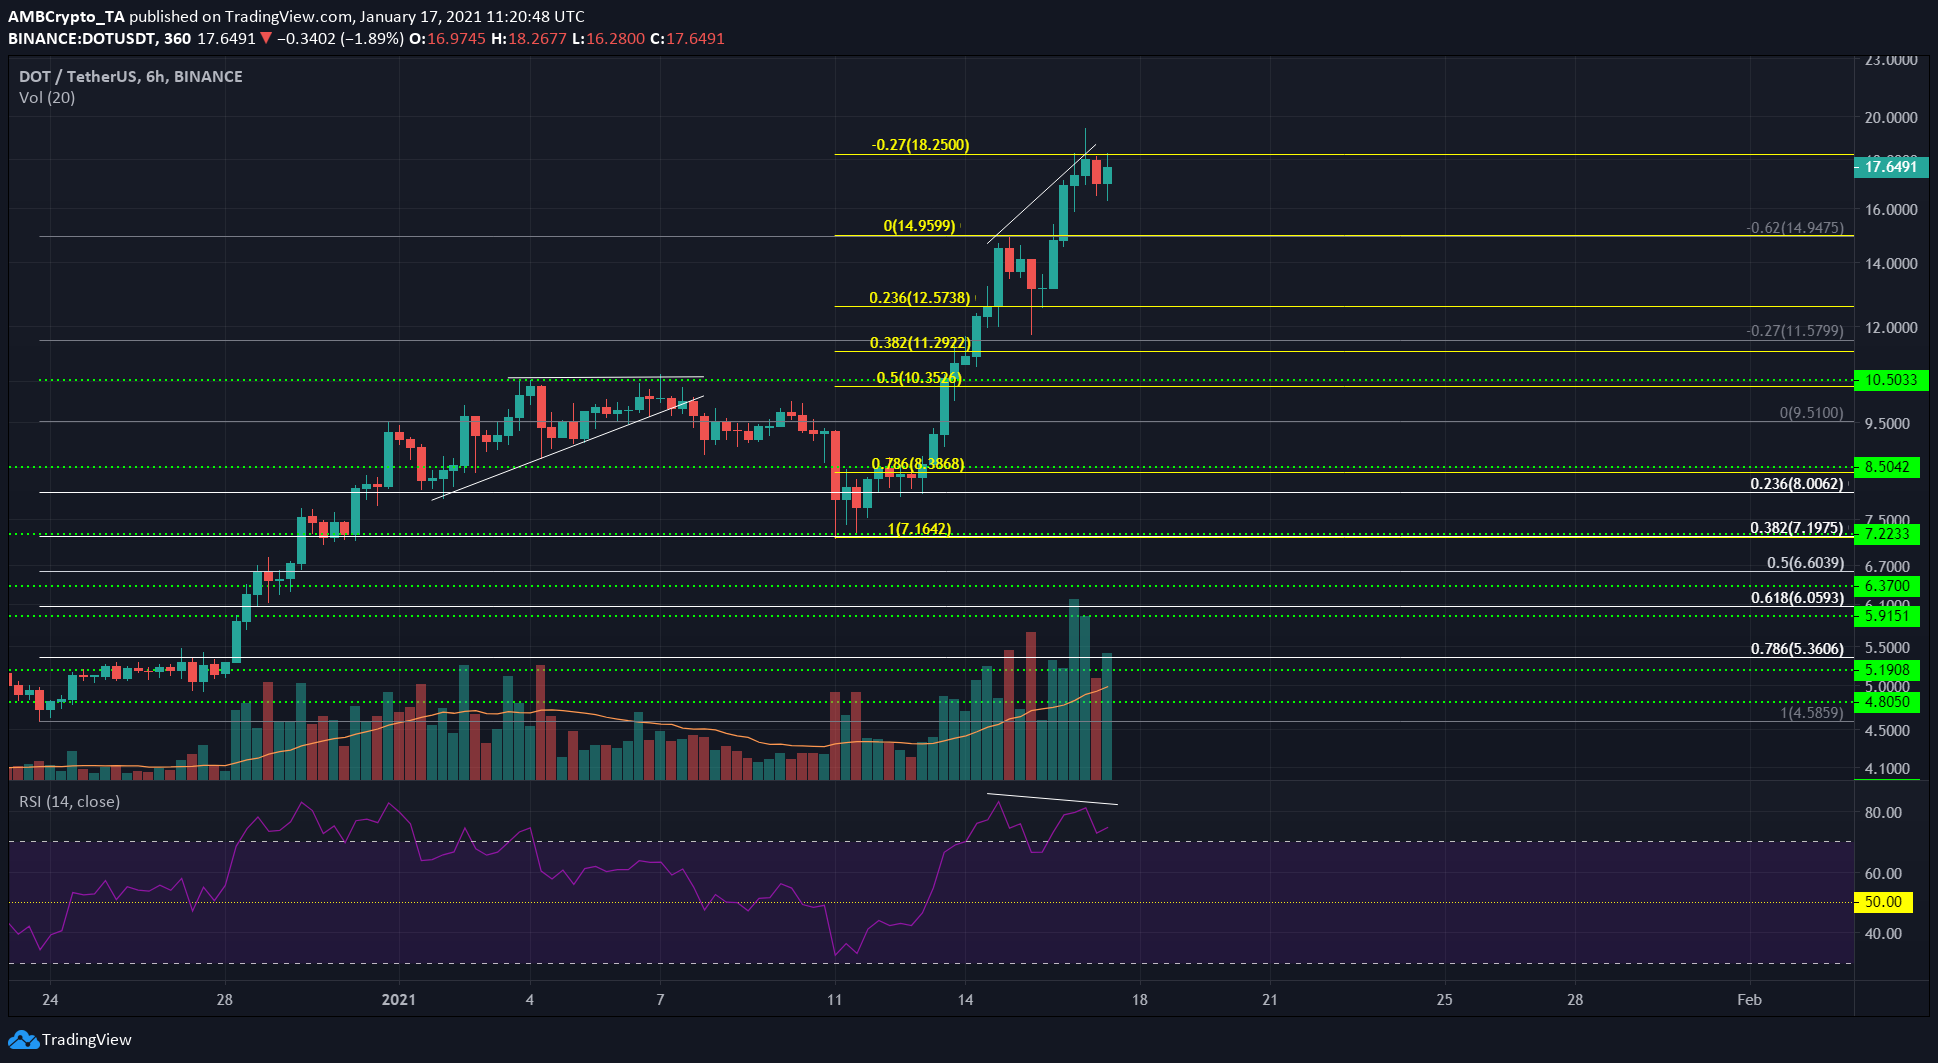
On the 6-hour chart, a bearish divergence is seen between price and its momentum. Divergences are not tools to time an entry into a trade – however, they do warn of corrections in both directions.
Using the Fibonacci tool, some levels of retracement are highlighted. The confluence between the retracement levels for different DOT moves – such as the $11.29-$11.57 region confluence (yellow and gray retracement levels) – indicates a potentially strong region of support.
Divergences on longer timeframes are more significant, and a deeper correction for DOT can be seen. However, the bullish sentiment on the market can spark at any time – ETH is quite close to its ATH, and can easily see a surge in DOT prices as well.
Hence the highlighted support regions, if DOT gets there, would present excellent opportunities to scale into a position.
Ontology [ONT]
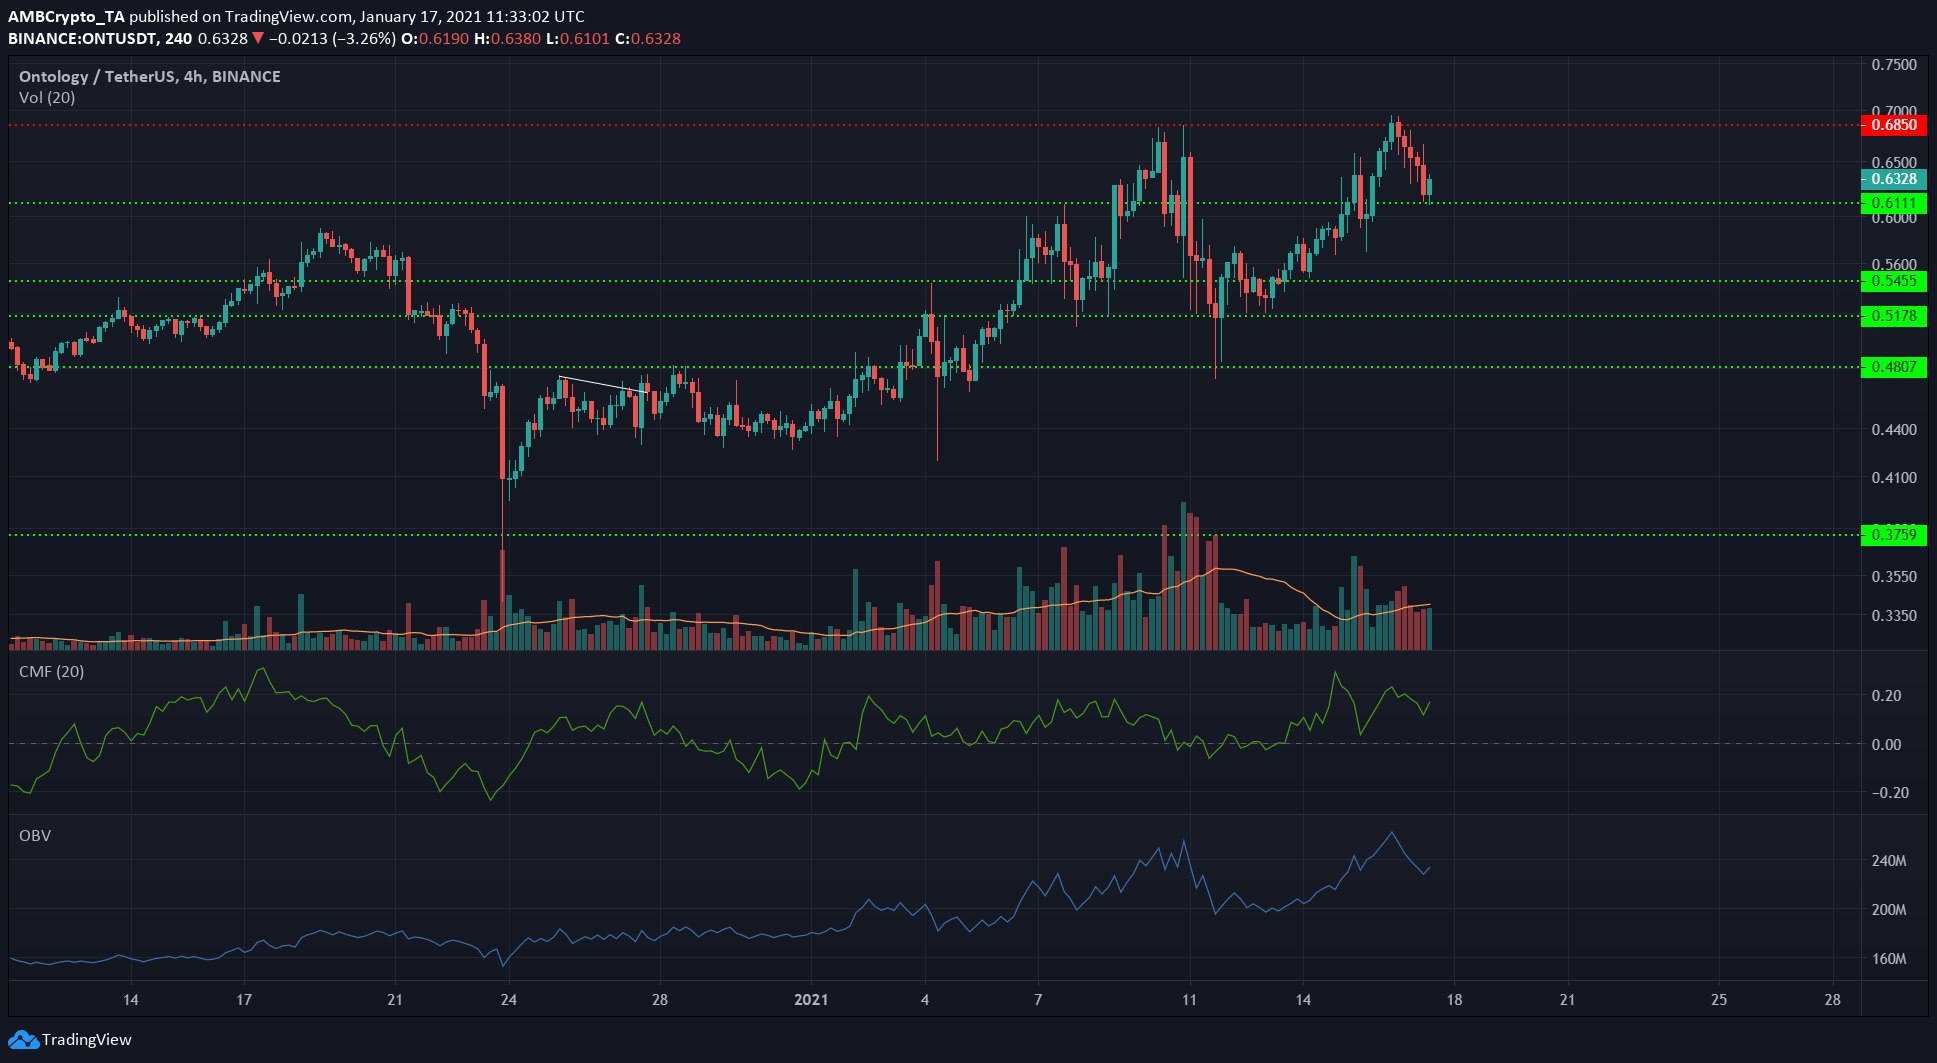
The $0.68 level of resistance has rebuffed ONT twice over the past week, but a series of higher lows have been formed and it is likely ONT would retest resistance and breakout to the upside.
The OBV and ONT prices were both in an uptrend and showed no divergences to act upon. The Chaikin Money Flow also indicated net capital flow into the market to highlight buyer interest in the digital asset.
FTX Token [FTT]
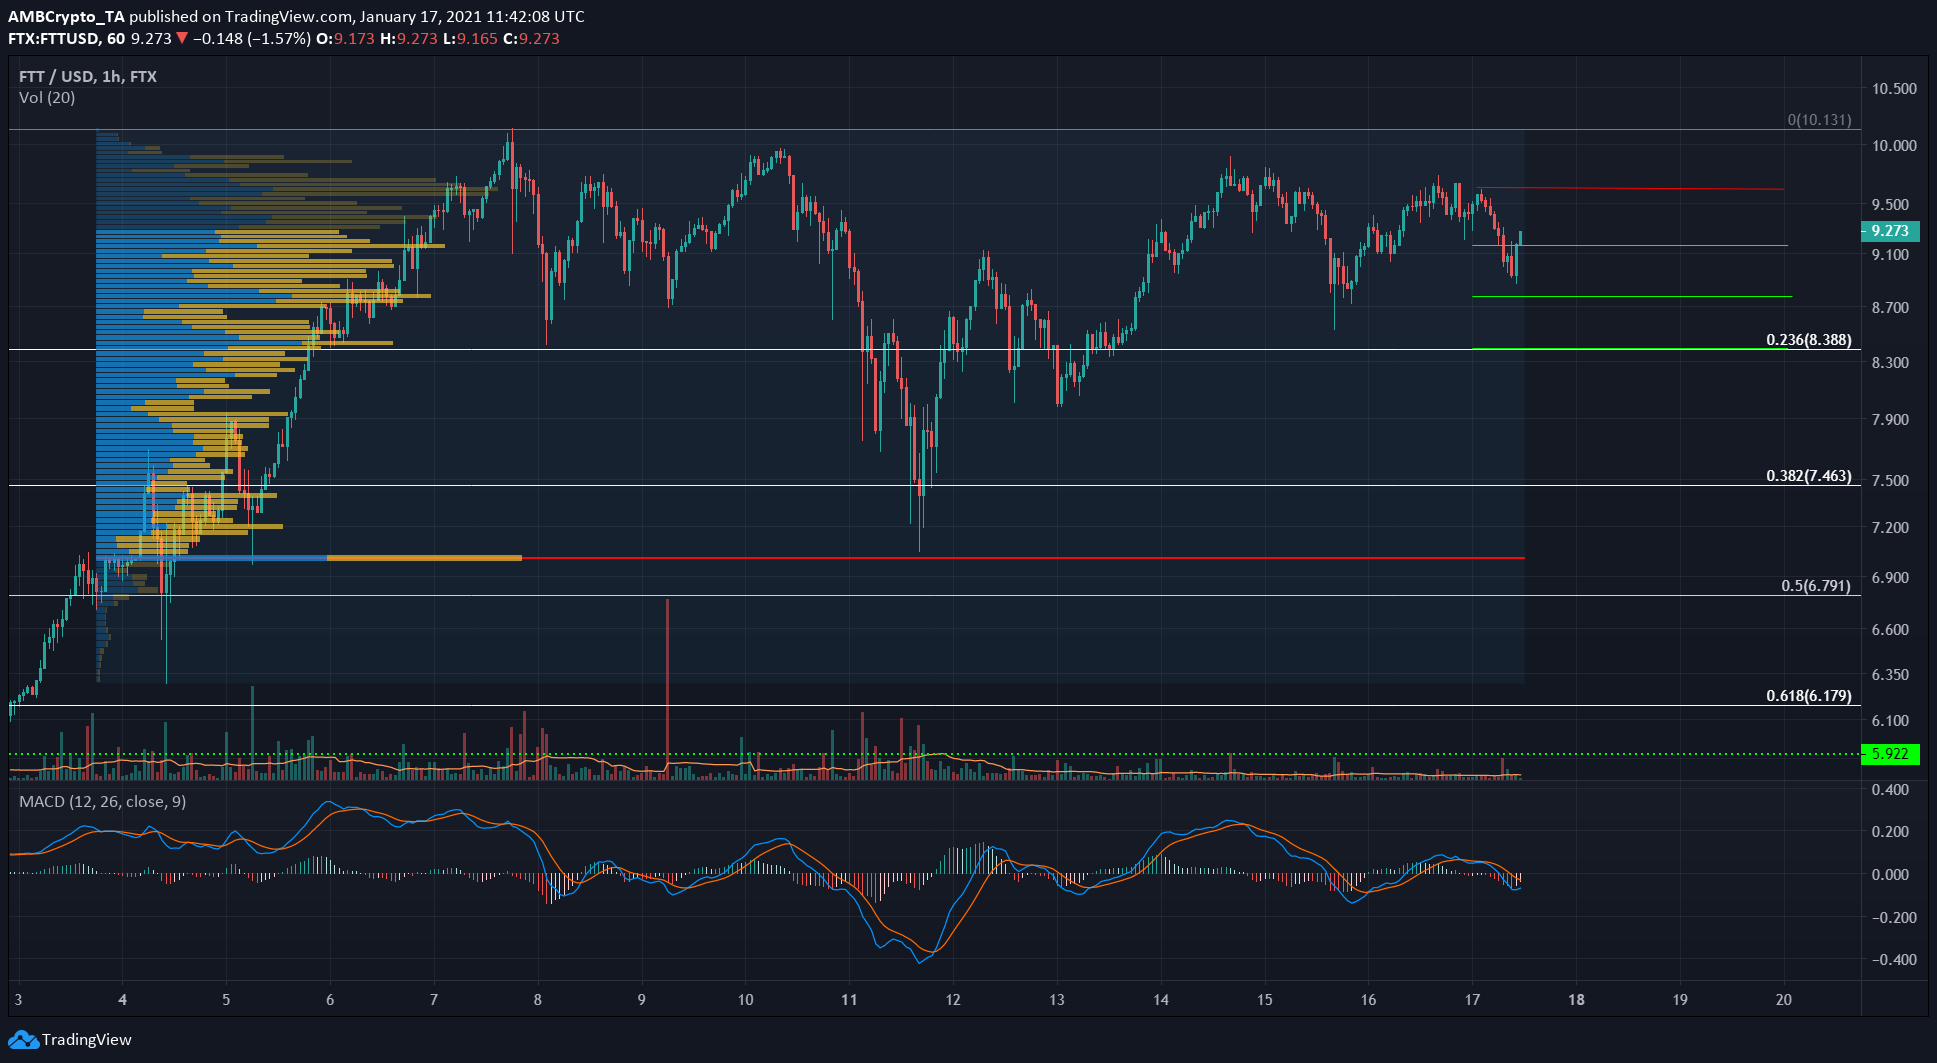
Over the past 10 days, FTT has met stubborn resistance in the $9.8 region. Using the Fixed Range Volume Profile on the 1-hour chart to give some short-term support levels for FTT, the $8.38, $8.76, $9.18, and $9.64 are the immediate levels to watch out for.
The MACD dived beneath the zero line and further bearish momentum can be seen that would take FTT to the aforementioned levels.
While the longer-term outlook remains bullish, over the next few hours, FTT is likely to register some losses.