Polkadot Price Analysis: 11 March

Disclaimer: The findings of the following analysis are the sole opinions of the writer and should not be taken as investment advice
Over the past week, Polkadot hasn’t performed as well as other altcoins in the market. However, the token did manage to keep its position on CoinMarketCap’s rankings. Maintaining a market cap of over $30 billion, the next few weeks could be extremely bullish for DOT, with the altcoin’s long-term price layout presenting very positive signs.
Polkadot 12-hour chart
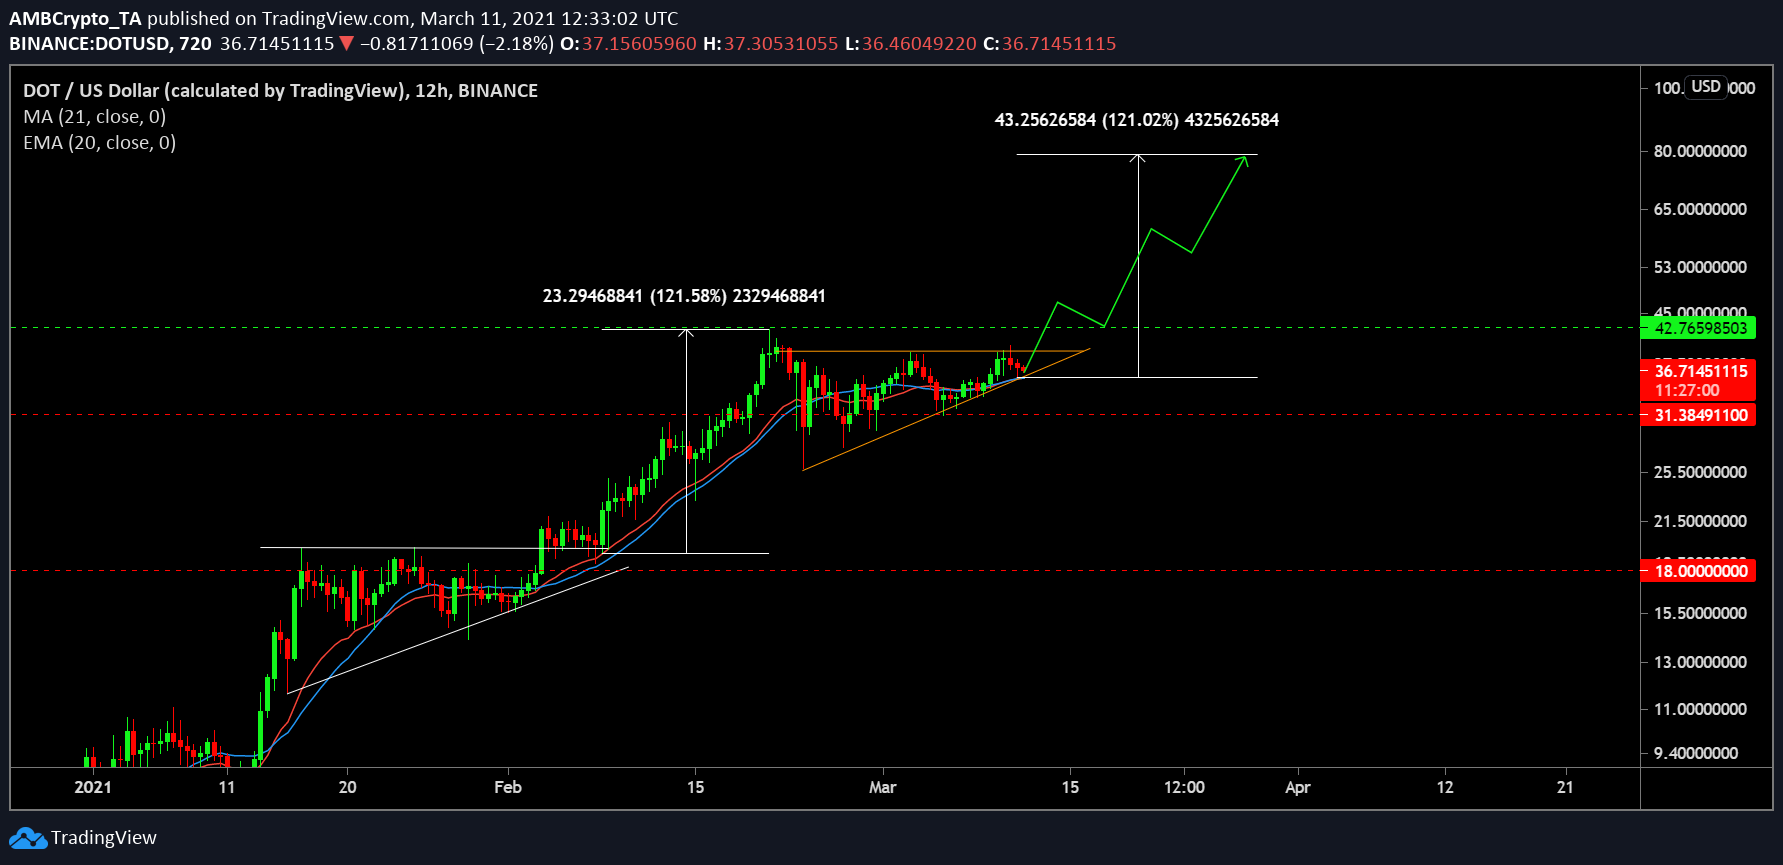
The bullish breakout that took DOT all the way up to $43 in mid-February seemed to be taking shape again in the form of another solid ascending triangle, at press time. In fact, the altcoin’s price has already tested the upper resistance line of the pattern thrice since the end of February.
A positive crossover was also observed between the 20-Exponential Moving Average and the 21-Simple Moving Average, something that triggered the rally at the start of last month. For DOT, trading volume climbed to an all-time high on the chart, with the same likely to project the possibility of a sell-off. Collectively, however, the trend seemed to be leaning in favor of the market’s bulls.
A similar breakout would easily allow DOT to climb to $50-$60 during the initial surge, which it may transcend later, before establishing a position above $70.
Market Rationale
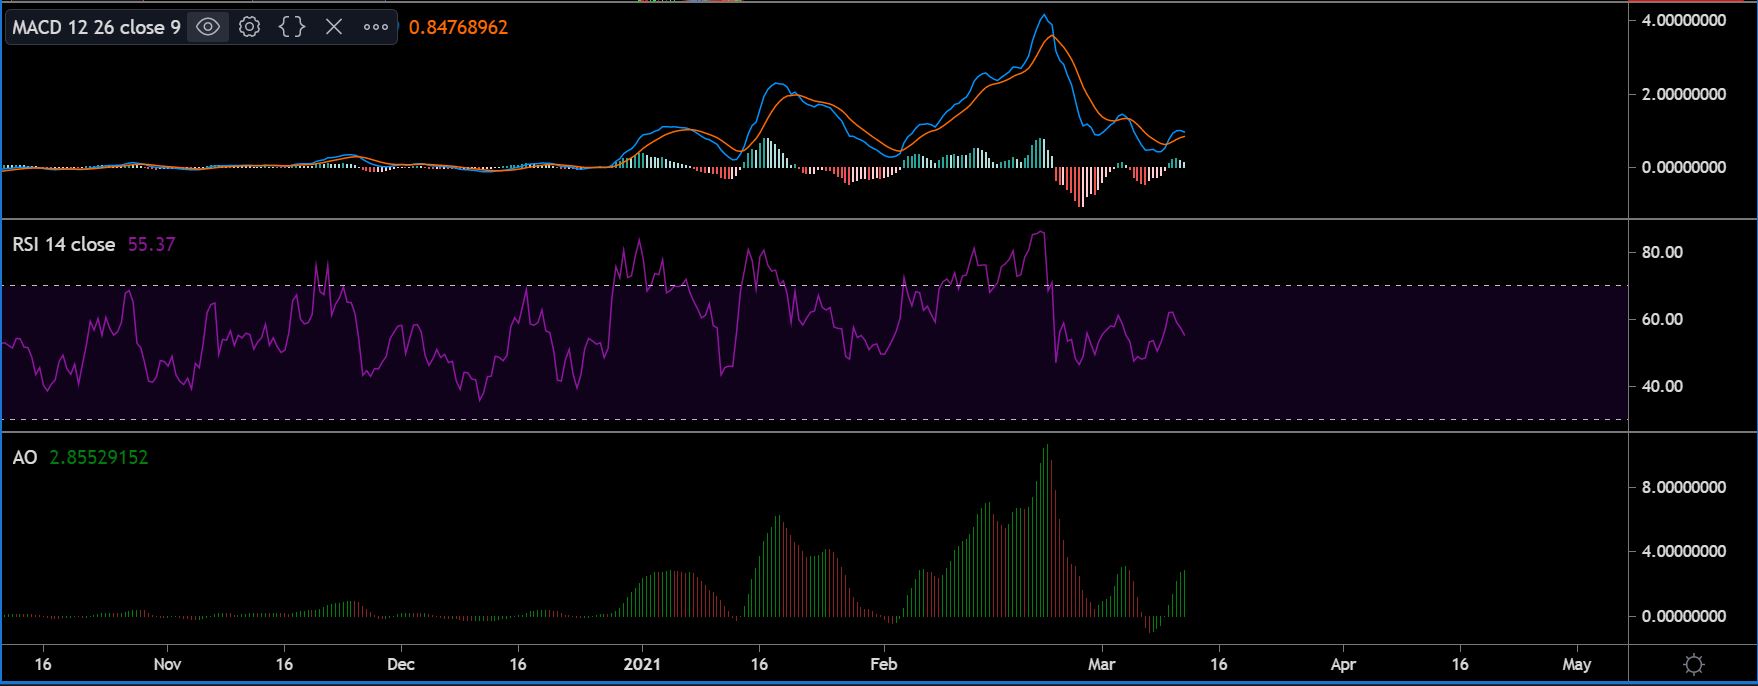
Market indicators pictured a complete reset as well. The MACD completed a bullish crossover over the last 24 hours, with the same mirroring a similar image as the previous cycle, at press time.
With respect to the Relative Strength Index or RSI, there seemed to be a debate that selling pressure could take short-term precedence over the next few days, but a recovery from the neutral point should swing back towards the buyer’s side.
Finally, the Awesome Oscillator or AO also exhibited a prime recovery in terms of bullish momentum, after navigating bearish sentiments over the past couple of weeks.
Verdict
While the market structure remains bullish, a confirmation will be necessary before entering a trade. If DOT breaches its ascending triangle over the next week, a position can be opened with respect to understanding the trading sessions ahead.