
Disclaimer: The findings of the following analysis are the sole opinions of the writer and should not be taken as investment advice
In early February, Polkadot broke out of its range highs at $18 and the following two weeks saw the price surge to an all-time high of $42.28. Since then, DOT has been rejected multiple times at the $38.2-level of resistance. However, another breakout to the upside remains a likelihood.
Polkadot 12-hour chart
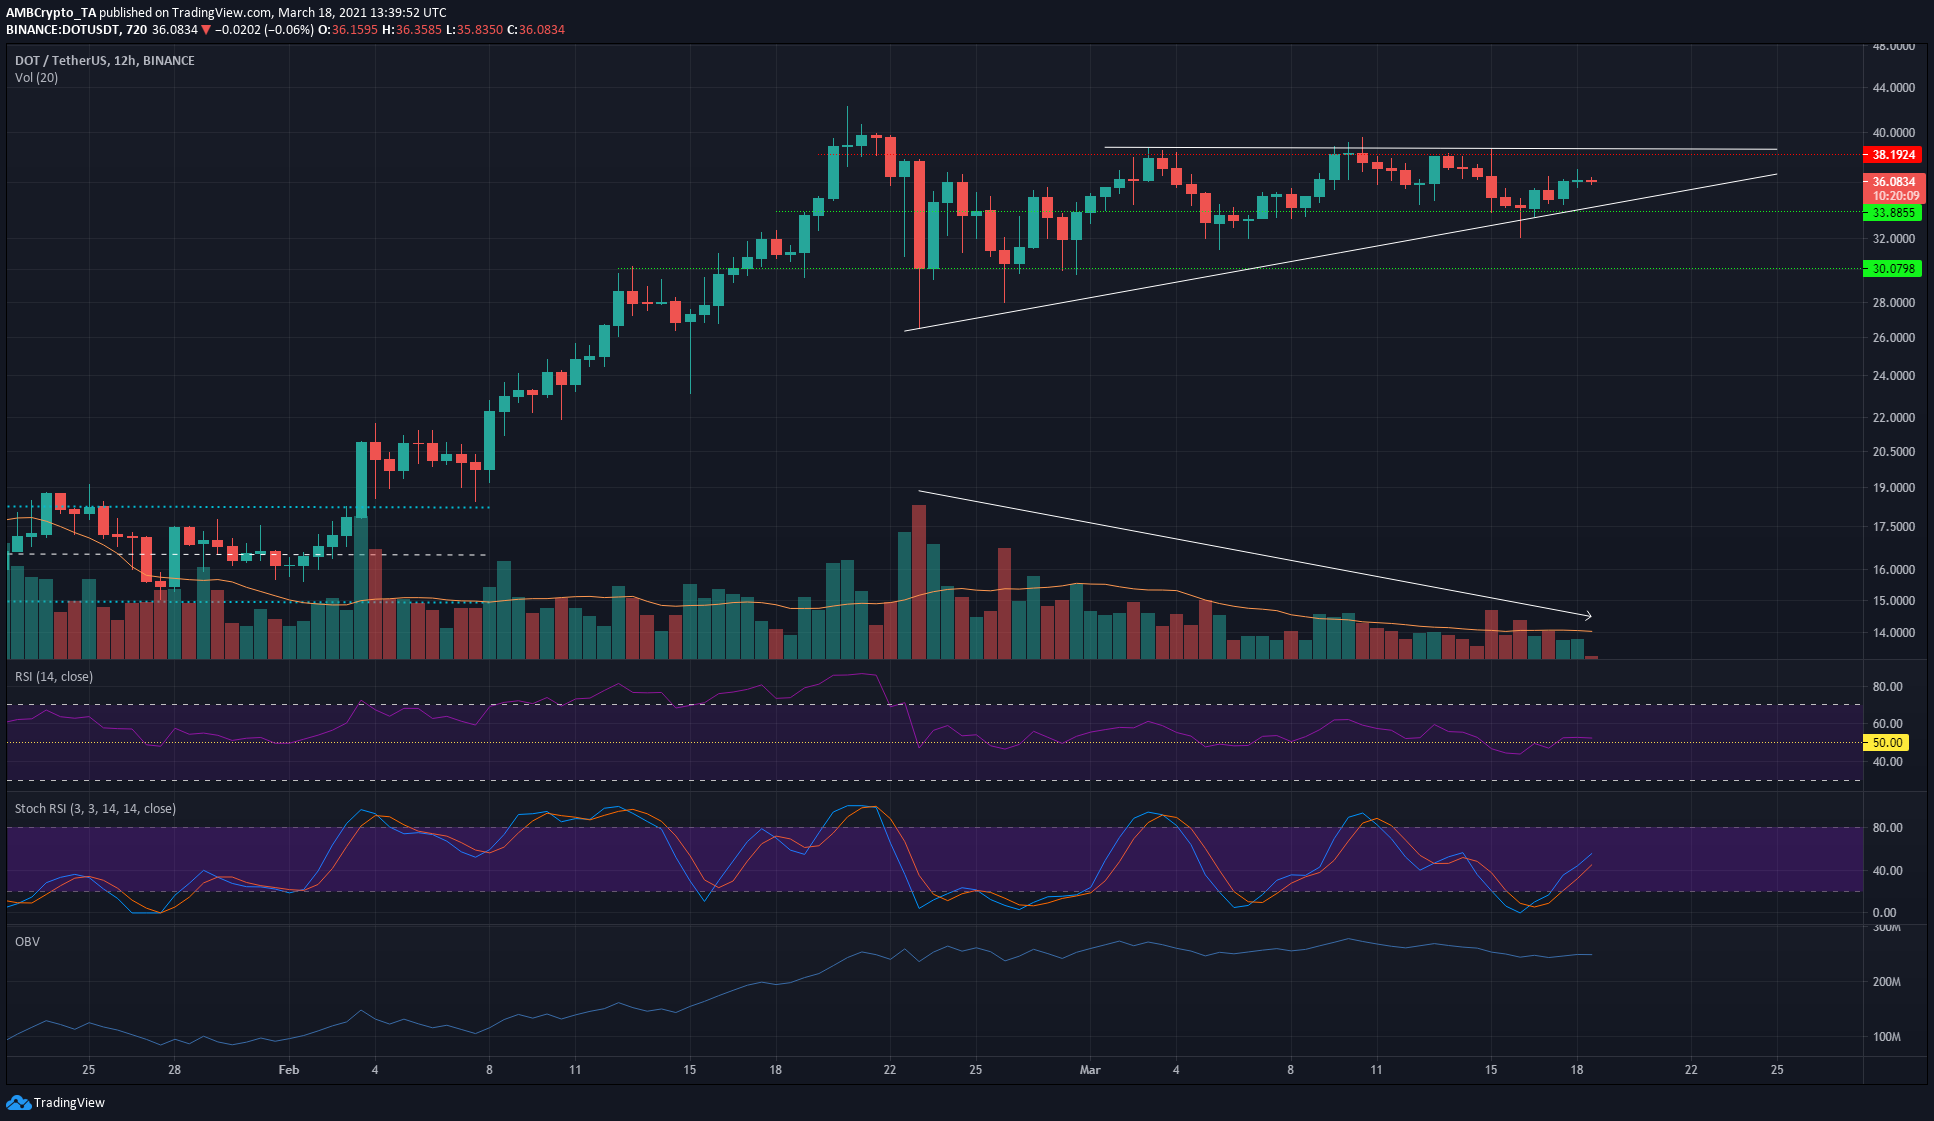
Source: DOT/USDT on TradingView
The 12-hour chart highlighted the rejection at the resistance, however, higher lows have been registered on every rejection. This fuels bullish expectations for DOT in the coming weeks since the chart formed an ascending triangle pattern.
Reasoning
The ascending triangle chart pattern witnesses an upward breakout more often than not. Considering the strong uptrend prior to the pattern formation, a further rise in DOT prices (after the consolidation phase over the past 2 weeks) appears more likely than a pullback towards $30.
The RSI was near the neutral 50 line, underlining no real momentum behind DOT over the longer timeframes. Further, the Stochastic RSI was recovering from oversold territory.
The OBV was also relatively flat, although lower timeframes such as 4-hour showed the OBV trending downwards over the past three weeks.
Important levels
The $38.2-$38.7 area is the most significant area of resistance for DOT in the coming days. The ascending trendline can also be expected to act as support for DOT. A breakout past $38.2 would target $46, based on the width of the triangle pattern.
A stop-loss hunt to support level at $33 before a move upwards is also possible, although such a drop would adversely affect the strength of the succeeding breakout.
Losing the $33-level to the bears will likely see DOT drop to $28.8.
Conclusion
The triangle pattern highlighted the DOT market gathering steam for its next strong move, and the direction of the move would still need confirmation over the next few trading sessions.